


 Thanks to some “elegant” math, Tamás Budavári and his team have created a user-friendly catalog of images from the Hubble Space Telescope, effectively putting all the insights they hold at our fingertips.
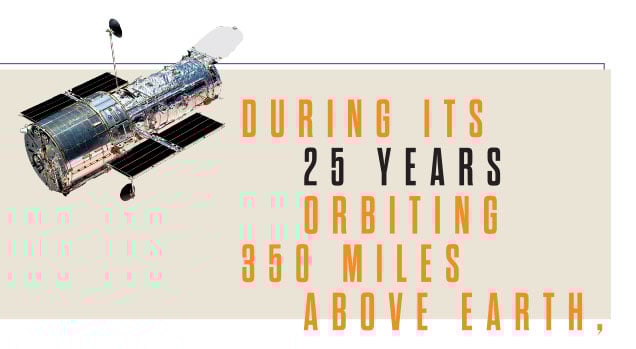 During its 25 years orbiting 350 miles above Earth, the Hubble Space Telescope has transformed the way we view the universe. The so-called “little telescope that could” helped confirm the existence of dark energy and the age of the universe (13 to 14 billion years). It has also shed new light on many of the other mysteries in astronomy.
Thanks to a groundbreaking new tool, Hubble’s legacy of enabling that kind of revolutionary science will continue long after the satellite has been decommissioned (predicted by NASA to happen over the next few years).
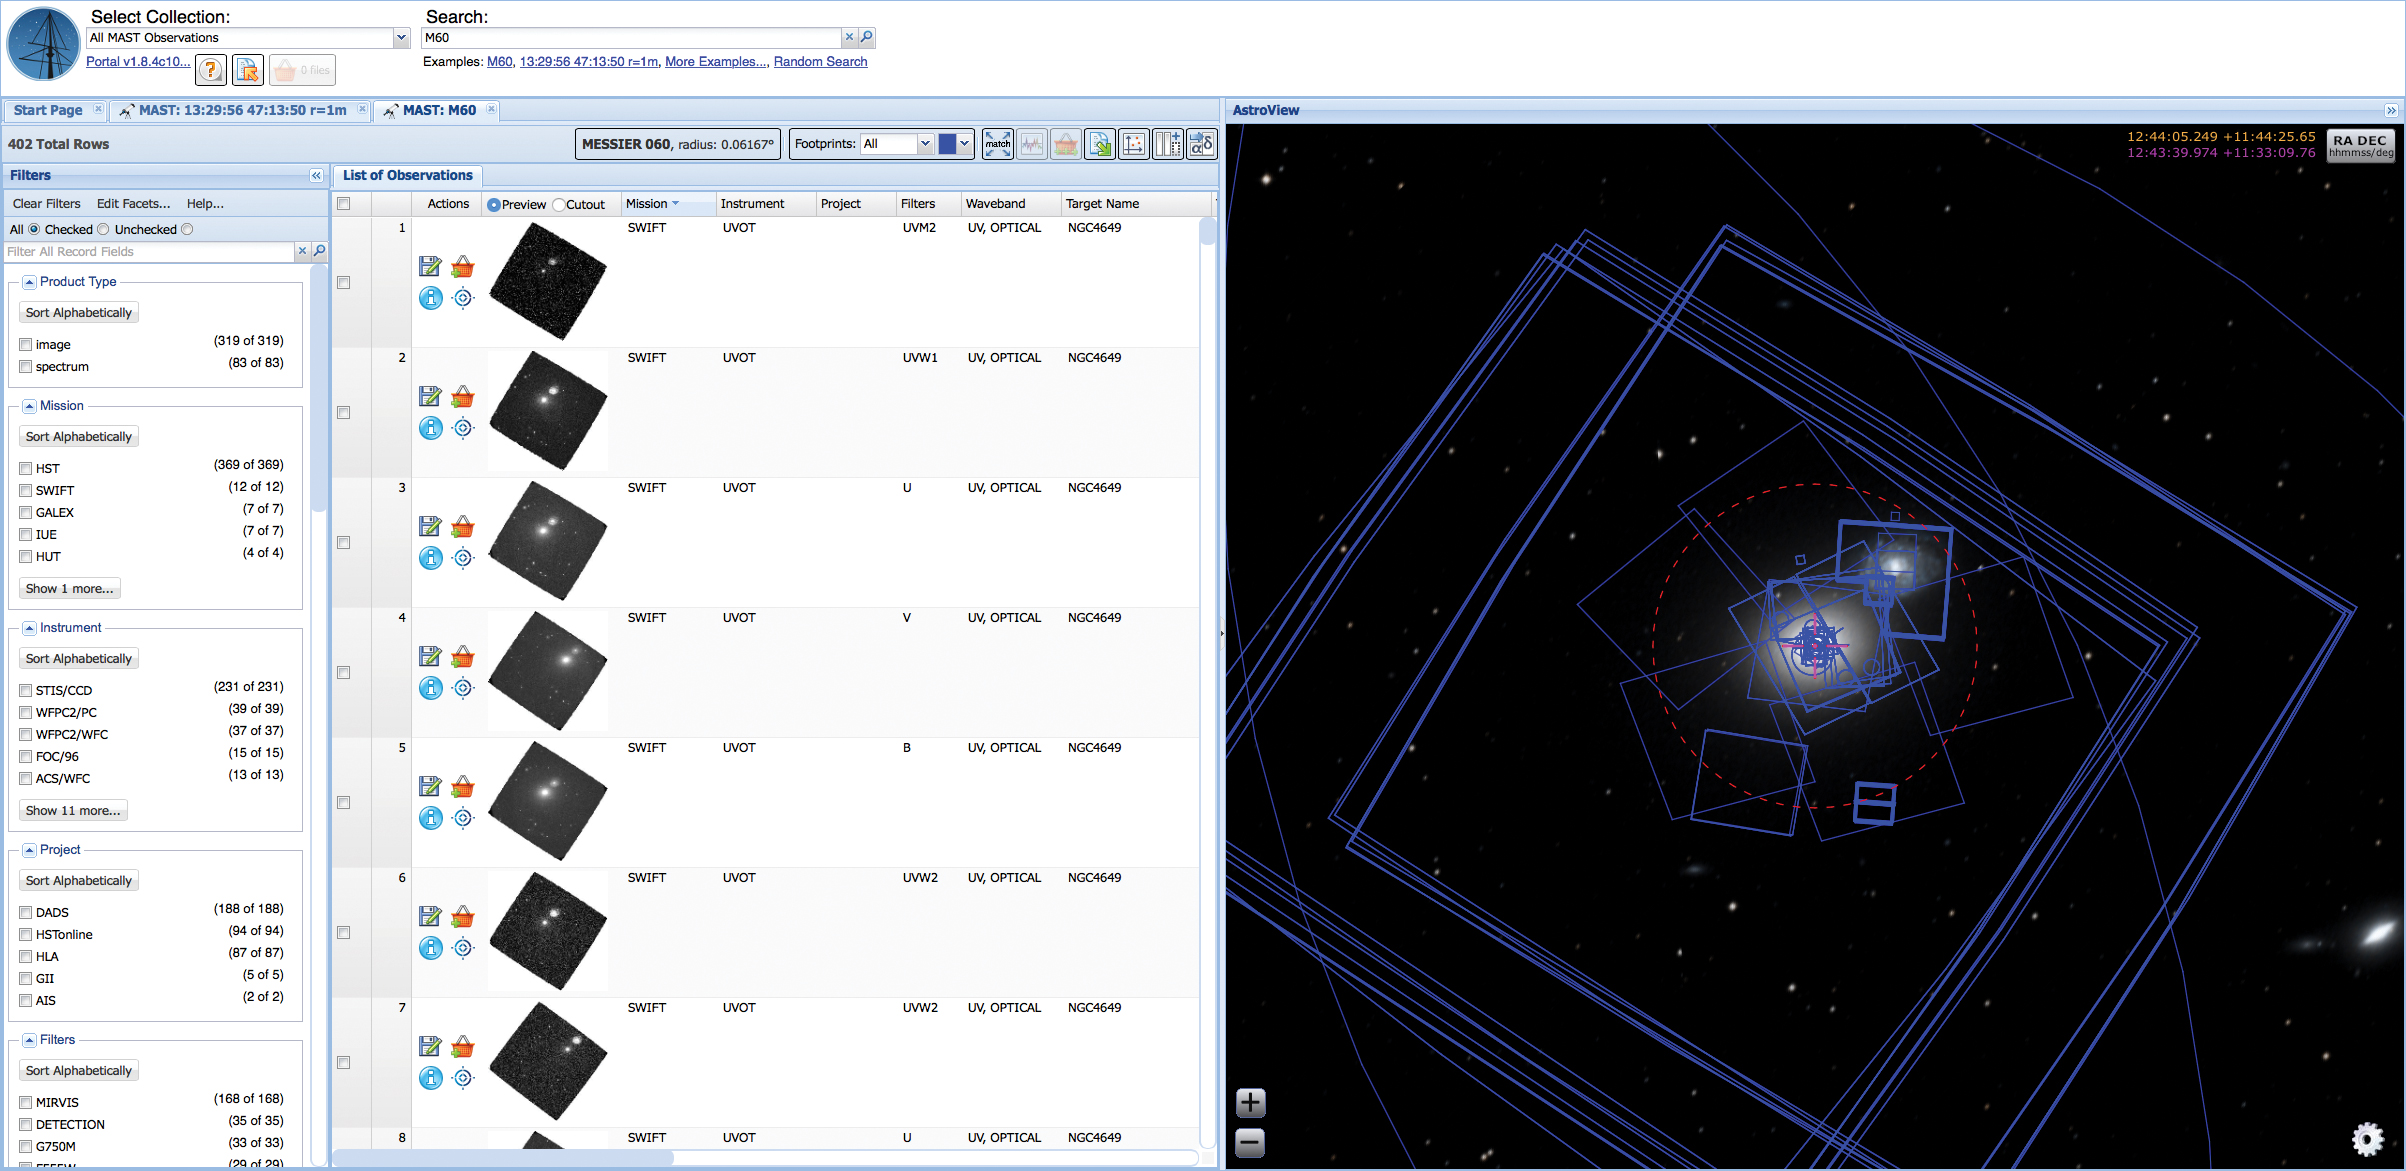
Created by Whiting School mathematician Tamás Budavári and a team of astrophysicists at the Space Telescope Science Institute, the new Hubble Source Catalog brings together all observations taken by the iconic telescope into one comprehensive database and a convenient Web interface. The result? Data that is easy to access for everyone, from the most experienced researchers to amateur astronomers and high school students.
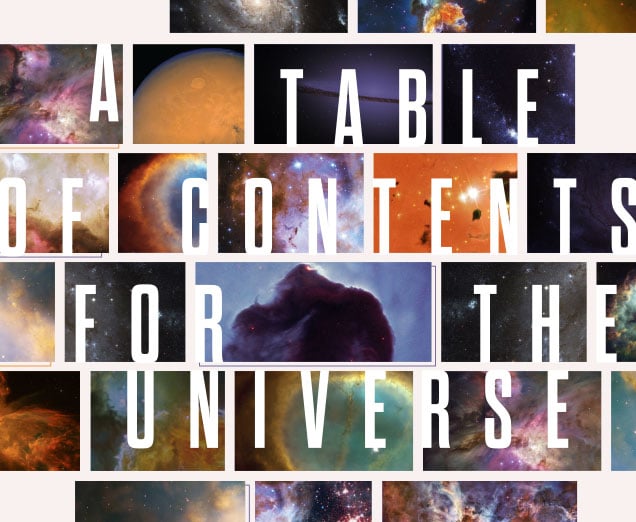
“The best way to describe the Hubble Source Catalog might be to say that it’s the ‘table of contents’ for and the summary of all measurements taken across time by the Hubble,” says Budavári, an assistant professor in the Department of Applied Mathematics and Statistics. “It’s all there, at your fingertips.”
The team’s ability to create this exciting new tool was due, in large part, to Budavári’s contribution: what he calls an “elegant math trick” that helped cross-reference and align the exposures—all taken on slightly different coordinate systems.
“These are the deepest observations of the universe ever taken, but that depth comes at a price: Each exposure has a small field of view with only a few standard stars that would allow us to calibrate the measured directions,” he explained. “I had to find a way to put them on a common frame of reference and figured that three dimensional rotations should do the trick.”
Hubble visited some parts of the sky more than a thousand times, collecting such a large volume of data that the usual trigonometric approaches would be too complex and thus too expensive. Budavári recognized that “the magic happens in the limit of infinitesimal rotations,” which boil the problem down into a three-by-three linear equation.“As soon as we ran the algorithm on the data, we knew we hit gold: The sources inseparate visits aligned perfectly with accuracies practically down to subpixel levels, which represent orders of magnitudes of improvements,” he says.
A key practical element of the Hubble Source Catalog is that it runs completely inside the database engine, where the data reside. Finding overlapping observations, cross-referencing sources, and the registration of images are all implemented in the Structured Query Language, which ensured that the small team could achieve its big goal.
“This is a great success of data-intensive science, which has been a major thrust of Hopkins’ Institute for Data Intensive Engineering and Science,” says Budavári, who is a member of IDIES.
For the team, the most exciting part of the project is the science it will enable for years to come. “Using this tool, scientists can do research in minutes that would literally have taken months and even years previously,” Budavári says. “This means that researchers can now ask—and answer—questions that they haven’t dared to tackle or even thought of yet.”