

Create
Design Project Gallery
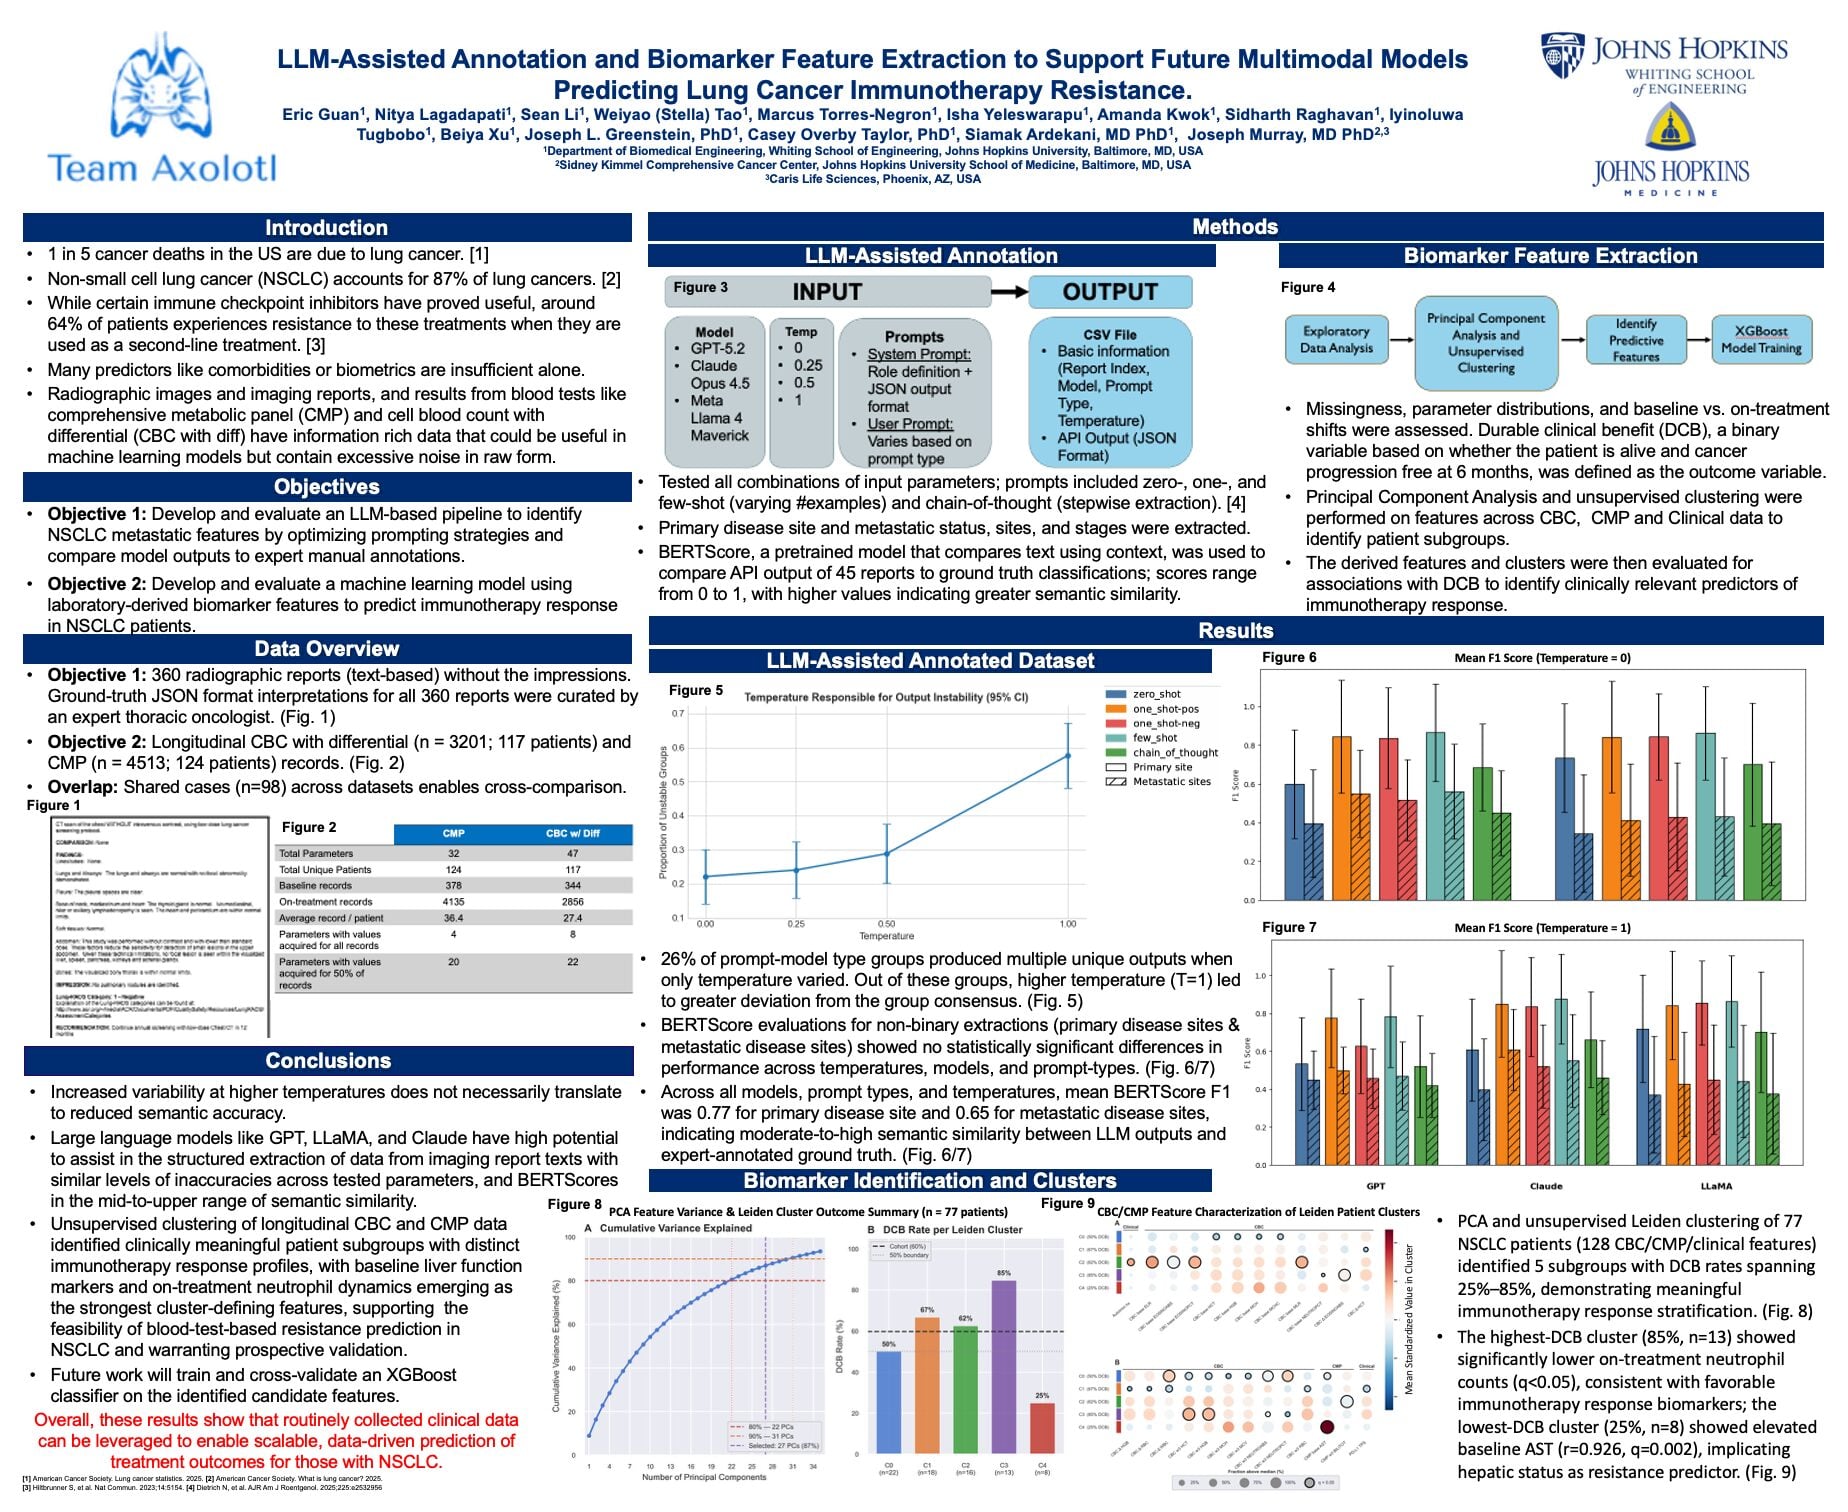
LLM-Assisted Annotation and Biomarker Feature Extraction to Support Future Multimodal Models Predicting Lung Cancer Immunotherapy Resistance
- Program: Biomedical Engineering
- Course: EN.580.480 Precision Care Medicine
- Year: 2026
Project Description:
This project develops an AI-driven framework for early Parkinson’s disease (PD) diagnosis using non-invasive ocular motor biomarkers. While eye movement abnormalities such as saccades, fixations, and smooth pursuit, often precede classical symptoms, a lack of labeled clinical data hinders current diagnostic abilities. To solve this, we generated physiologically guided synthetic data by modeling PD-specific dysfunctions within known mathematical frameworks. Using the ControlNeXt pose-guided pipeline, the raw waveforms are converted into realistic eye-movement videos. This approach addresses data scarcity and provides clinicians with a more objective diagnostic tool. Our framework is validated through expert review, statistical comparisons with real patient distributions, and multimodal classifier testing. By bridging mathematical modeling and video synthesis, this project offers a scalable, objective tool for early PD screening, providing a path toward more accessible neurological diagnostics.
Project Photo:

Team Axolotl: Where AI-driven annotation meets biomarker discovery to power multimodal prediction of lung cancer immunotherapy resistance
Project Poster
Open full size poster in new tab (PDF)
Project Poster Summary:
This poster outlines the background behind lung cancer, specifically non-small cell lung cancer, and introduces the problem of predicting immunotherapy resistance. The two main objectives are stated, and an overview of the data is provided for each of the objectives with an example of a radiographic report as well as a table summarizing blood test records. The methods section outlines the workflow for LLM-assisted annotation, as well as the workflow for biomarker feature extraction. Results for the LLM-assisted annotated dataset are given in the form of line and bar plots summarizing results from the temperature experiments. The results for biomarker identification and clustering are presented in the form of clustered dot plots.