People
| Postdoc | Omri Ram |
| Graduate Student | Karuna Agarwal |
| Project Supervisor | Prof. Joseph Katz |
| Design & Technical Support | Dr. Yury Ronzhes |
Introduction
Characterization of cavitation inception in turbulent shear flows is a major challenge since it involves complex interactions between the nuclei and the unsteady pressure field. In a turbulent shear layer, the onset of cavitation occurs predominantly in the weaker quasi-streamwise vortices (QSVs) that form intermittently in between the primary spanwise Kelvin-Helmholtz vortices (Katz and O’Hern, 1986). The cavitation inception indices increase with the Reynolds number. This trend implies that either the pressure minima in the core of the QSVs or the entrainment of nuclei into them do not scale with the velocity squared. This project characterizes both for a range of Reynolds numbers.
Facility
All the experiments are performed in a water tunnel located in Latrobe Hall at JHU. The tunnel is operated by two pumps located 5 m below the test section to avoid cavitation of the machines. A settling tank of volume 1000 liters captures large nuclei and act as a reservoir while deaerating the system. At the test section, mean flows of upto 18 m/s can be realized and pressures can be varied between 0.1-3 atm.
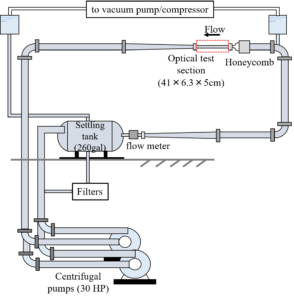
The water tunnel
In addition, the test section is fitted with following measurement systems:
- Pressure transducers
- Dissolved oxygen meter to estimate the freestream nuclei content
- Mono-disperse bubble injector
- 2D PIV system
- Tomographic PIV system
- Holographic system
- High speed cameras (1-5000kHz)
Experiments
The experiments are performed in the near field of the shear layer generated by a backward-facing step of height h=10 mm. The step rises gently, following a fifth-order polynomial. Using 2D PIV, we have characterized the mean and rms flow quantities from the step to the reattachment zone. The mean flow as well as the turbulence intensities scale with the free-stream velocity U and the reattachment length x_r. The incoming boundary layer at the step is fully turbulent with shear Reynolds numbers of 365, 800, 1500, 2310 at U=1.45, 5.3,10.5,16 m/s respectively. A sample cavitation event as well as the test section geometry is displayed. (Fig.2)
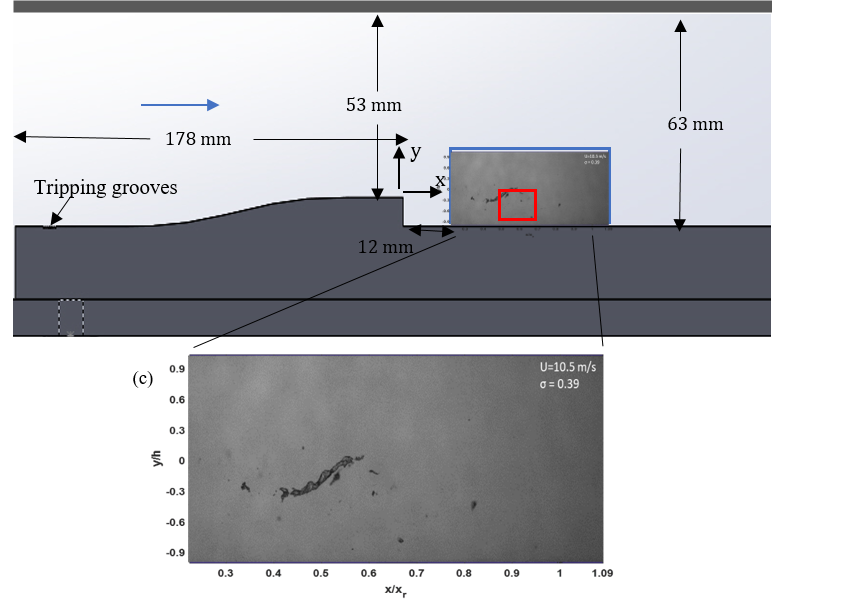
Figure 2
The cavitating quasi-streamwise structures are observed for experimental conditions at U>7m/s. High speed imaging (4kHz) allows us to observe the motion, the sizes and the likelihood of these cavities. Figure 3 presents the likelihood maps at two speeds and different pressures. Most of the cavitation takes place between 0.45 x_r to 0.75 x_r. As expected, the likelihood of cavitation increases as the pressure drop. At the same cavitation index, even as U increases 1.5 times, the probability increases 5 times. Based on these probability maps, a 12.5×7.5×4.5 mm region is observed using tomographic PTV (based on Shake-the-box algorithm). Eight time-resolved datasets, each lasting about 3.5s, have been collected, resulting in 420000 and 170000 snapshots for U=5.3 m/s and 1.45 m/s, respectively. This large database allows us to perform statistical analysis involving ensemble and conditionally-averaged pressure distributions.
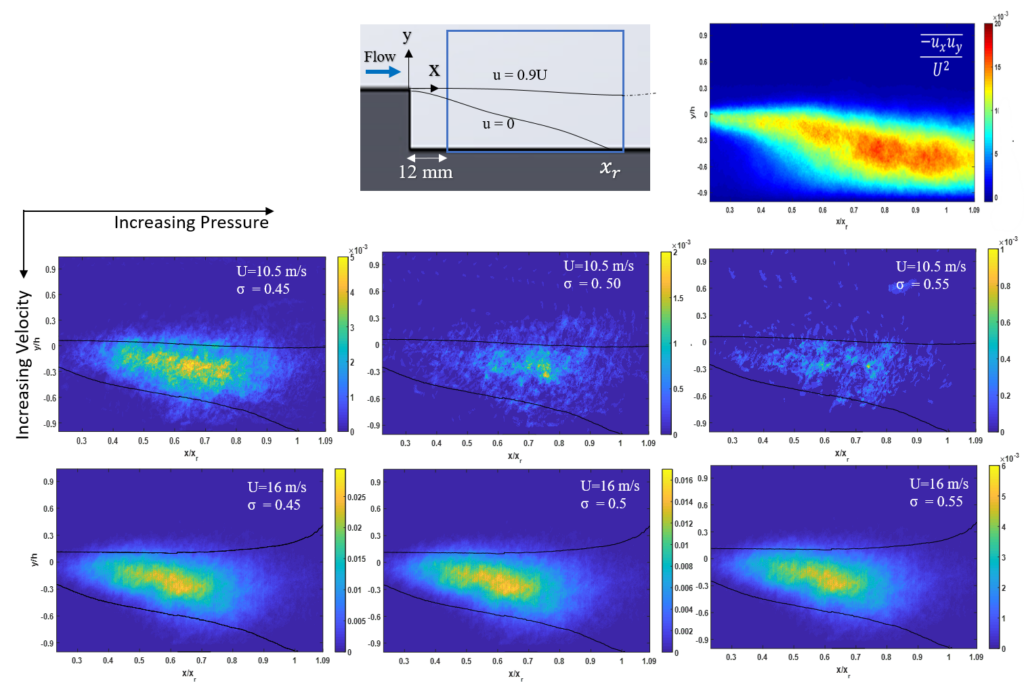
Figure 3
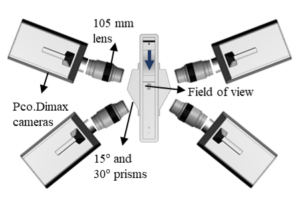
Top view of the tomographic PTV setup
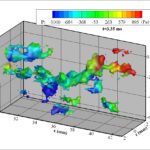
Resolving pressure fields with the sparse unstructured tracks is a challenge. To address this, we have developed and tested a Constrained Cost Minimization (CCM) procedure. The method imposes a divergence-free condition on velocity and curl-free condition on material acceleration field to result in vector spacing of 200μm. The 3D pressure distribution is calculated by spatially integrating the optimized values using a recently-introduced GPU-based parallel-line, omni-direction procedure.
The CCM code and the manual can be downloaded here: CCM_manual.
Ongoing analysis of the data show that the Reynolds number does not have a significant effect on the size or strength of the QSVs. These structures are more likely to be stretched axially compared to the rest of the sample volume, and pressure minima are more likely to be located and last longer in them. With increasing Reynolds number, the duration of low pressures inside the QSVs increases substantially. Planned holographic experiments will measure the entrainment and interaction of micro bubbles with the flow structures.
Publications
- Agarwal K, Ram O, Katz J (2018) Cavitating Structures at Inception in Turbulent Shear Flow, Proceedings for CAV18.
- Agarwal K, Ram O, Wang J, Katz J (2019) Velocity and pressure reconstruction from sparse particle fields, Proceedings for ISPIV19.