Open the inv_test file from the digital_lib_test library. In the schematic of inv_test, left click Editing:Tools -> Analog Environment. The spectre window should appear.

First, change the simulator to spectreS by left click ADE L:Setup->Simulator/Directory/Host… and choose spectreS as the simulator. Always choose spectreS for all simulations.
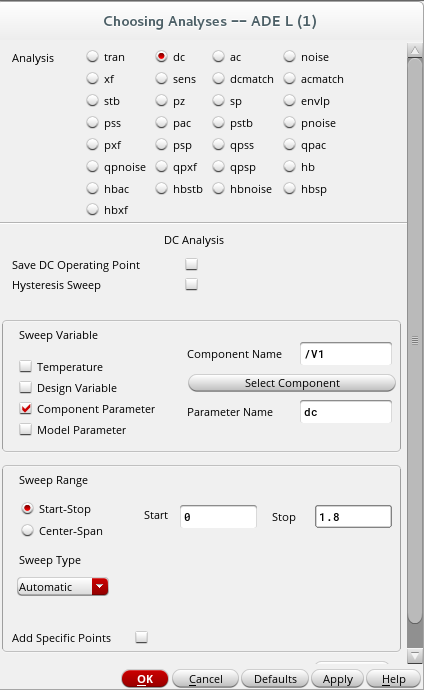
We want to specify the type of analysis we want to perform. We are going to select a DC analysis. Left click Analog Environment:Analyses->Choose. Click on the dc button for Analysis. Click Component Parameter button for sweep variable. In the Sweep Range, fill 0 and 1.8V for the start and stop. Left click on the Select Component. Now go back to the schematic and select the voltage source you want to sweep. Click on the vdc that is connected to the input of the inverter. This will pop-up a small window, which requests the Parameter Name. Click on dc to sweep the voltage. Go back to your Analysis Choose window, which should look like the one below, and click on OK.
Second, we want to select which output voltages to be plotted. Left click on Analog Environment: Outputs->To be Plotted->Select on Schematic. Click on the wire between your vdc source and the in pin of your inverter. Then click on the wire between the out pin of the inverter and the out pin. Both wires should change color indicating that these voltages will be plotted.
Note: If you want to select a current to be plotted, then click on the square of a symbol where the current is flowing through. There will be a circle around the square node indicating that a current is selected.
In order to make your simulation more readable, it is often advisable to name special nets with uniquely
identifiable names, so that when the simulation results are presented, they are more easily understood. To
do this, on the inverter_test schematic press the l (label) key, type in the word in, in this case, and
“attach” it to the input wire. Now on the Analog Environment, click on the net4 net and
then on the eraser to the right. Finally, reselect Outputs->To be plotted->Select on
Schematic and click on your input wire. in should appear where
net4 used to be.
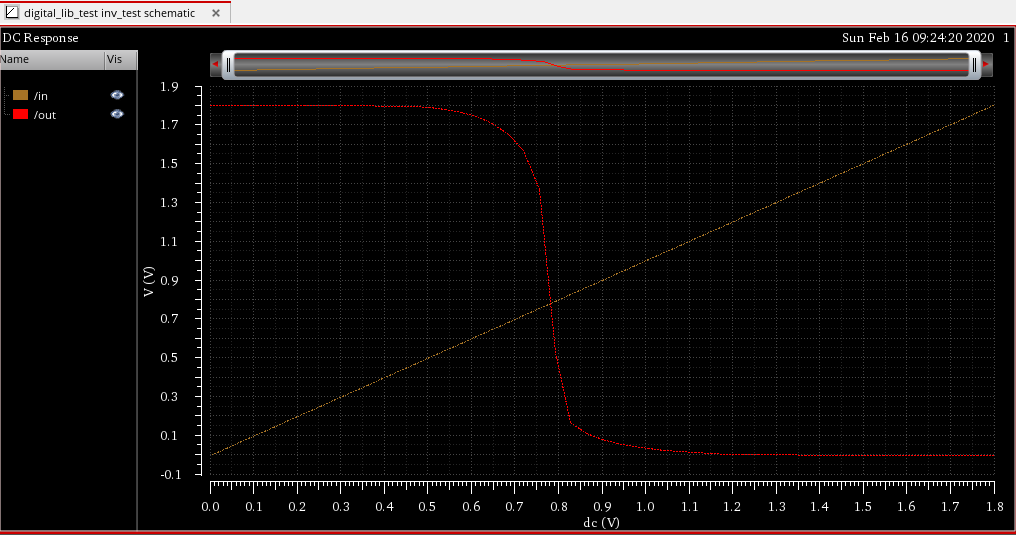
You are ready to run the simulation. Left Click Simulation->Run or click on the green traffic light icon in the Analog Environment window. The result window, as the one below will appear shortly. Explore the pull down menus in this window in order to customize your results. For instance, left click Axes->Strip in order to separate the different curves.
To save the results left click Waveform Window: file->save as image.
Now exit the Cadence Spice. Left click on Analog Environment:Session->Quit.