


In the weeks after the coronavirus was reported in Wuhan, China, Lauren Gardner, associate professor of civil and systems engineering and director of the Whiting School’s Center for Systems Science and Engineering, along with her first-year graduate student, Ensheng Dong, launched an interactive, Web-based dashboard to track the outbreak as it unfolded. Gardner, who studies the impact of human behaviors, such as mobility, on disease risk, thought the tool could be useful to colleagues working in her field.
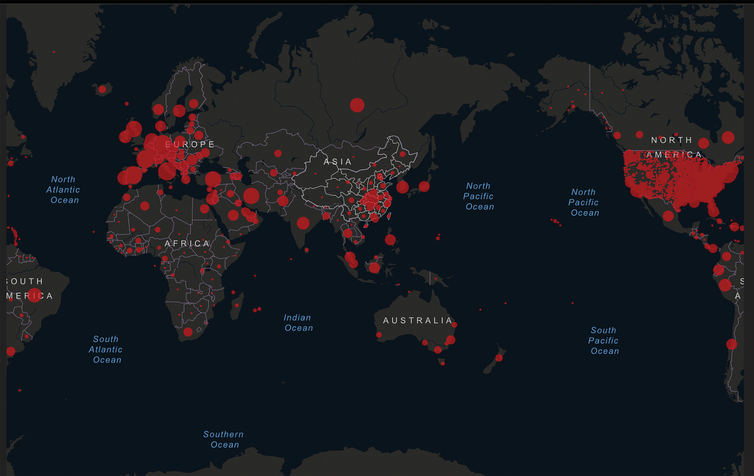
When the dashboard debuted on Jan. 22, mainland China’s 300 confirmed cases appeared as small to medium red circles concentrated around Wuhan, with a sprinkling of red dots spread across the country. Within four weeks, the country’s eastern half looked like a dense sea of red. A month later, Europe and the United States were blanketed in scarlet too.

In early March, Gardner, along with five other Johns Hopkins experts, led a panel discussion for reporters and congressional staffers on Capitol Hill about how COVID-19 is transmitted, how it is being tracked, and how governments, institutions, and individuals can prevent its spread. By that point, the user-friendly tool, which Dong built in just a few hours, had been shared by practically every major news outlet worldwide and was among the most widely cited information sources for COVID-19 data for researchers, public health authorities, and the public. Its black-and-red map became the backdrop for CNN’s round-the-clock reporting of the pandemic, and the website was getting more than 1 billion views a day.
The World Health Organization, the U.S. Centers for Disease Control and Prevention, and government organizations in Europe and China were the sources for the data that initially, Gardner and her team gathered, processed, and updated manually, while they also were responding to a constant stream of inquiries, bug fixes, and media requests. The speed and increase in scope of the pandemic’s spread, combined with growing round-the-clock demands, soon made this process unsustainable. With assistance from JHU’s Applied Physics Laboratory and ESRI, the developer of the dashboard’s geospatial mapping software, the core team of five grew to a group of more than 20, and the data process was mostly automated.
In early April, JHU’s Centers for Civic Impact, with assistance from APL and JHU’s Bloomberg School of Public Health, created data visualization tools on JHU’s Coronavirus Resource Center, a hub for university news, data, and health information about COVID-19. The tools enable users to track the number of new confirmed cases of COVID-19 in the 10 most affected countries, providing a means to gauge each country’s efforts to “flatten the curve” by slowing the rate of infection.
New features were added to the CSSE dashboard as well, including U.S. state-level curves and maps addressing fatality and hospitalization rates and more. The new features enable users “to effectively and intuitively understand how the outbreak is evolving and how it varies by location,” Gardner says.
Gardner now is working on mathematical modeling around the disease. “We are developing short-term forecasts to identify the set of counties likely to see the most new cases and deaths, which can be used for advance resource planning and allocation,” she says. Other projects include using the data set to understand the effects of social distancing on the outbreak growth rate and working with NASA, looking at the role of seasonality and climate in COVID-19 transmission.
Our researchers, medical teams, staff, and students are working tirelessly to help with testing, patient care, and preventive care—with your support we can do more! Visit engineering.jhu.edu/giving to make a gift in support of our efforts.