People
| Postdoc | Lakshmana Chandrala, Omri Ram |
| Former Postdoc | David W. Murphy, Pranav R. Joshi |
| Graduate Student | Xinzhi Xue |
| Former Graduate Student | Kaushik Sampath, Cheng Li |
| Undergraduate Student | Anne Hosler, David Morra, Ben Chello, Yvana Ahdab, Kyle Candela |
| Project Supervisor | Prof. Joseph Katz |
| Design & Technical Support | Dr. Yury Ronzhes |
Background
Subsea oil well blowouts, such as the IXTOC I and Deepwater Horizon accidents, can cause extensive environmental, economic, and public health damage. The magnitude and type of damage largely depends on the fate of the discharged oil. Oil rising quickly to the surface as large droplets may form slicks that hurt environmentally sensitive marshes or economically important beaches.
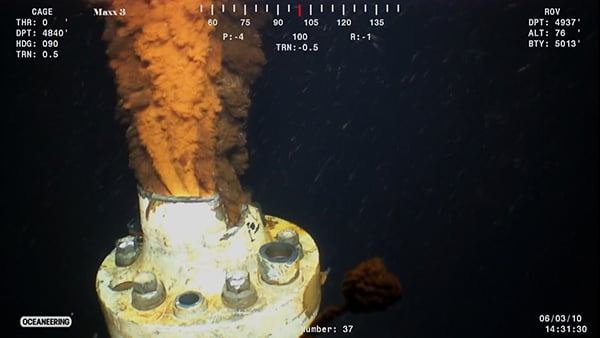 Remote Operating Vechicle (ROV) image of oilspill wellhead (Attribute to US DOE)
In contrast, the subsurface application of chemical dispersants to the wellhead, a practice pioneered during the Deepwater Horizon accident, may form subsurface regions with elevated hydrocarbon levels harmful to plankton and fish larvae. Understanding the transport of oil away from the wellhead and the effect of chemical dispersants on the oil fate is thus important in making policy decisions about dispersant application and tradeoffs among different types of possible damage.
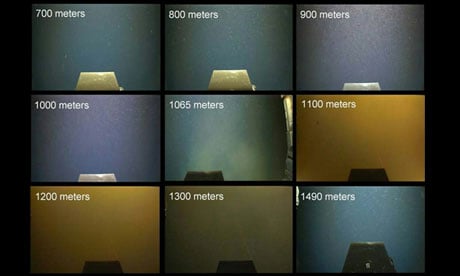 ROV image of oil layer in the water column
Goals
The project aims to simulate the ocean current cross-flow by towing an oil plume in a tank. It studies the structure of a multiphase plume (oil, gas, and water) in cross-flow, measures oil droplet size distributions and models the effect of dispersants on droplet size distributions and mixing in plumes.
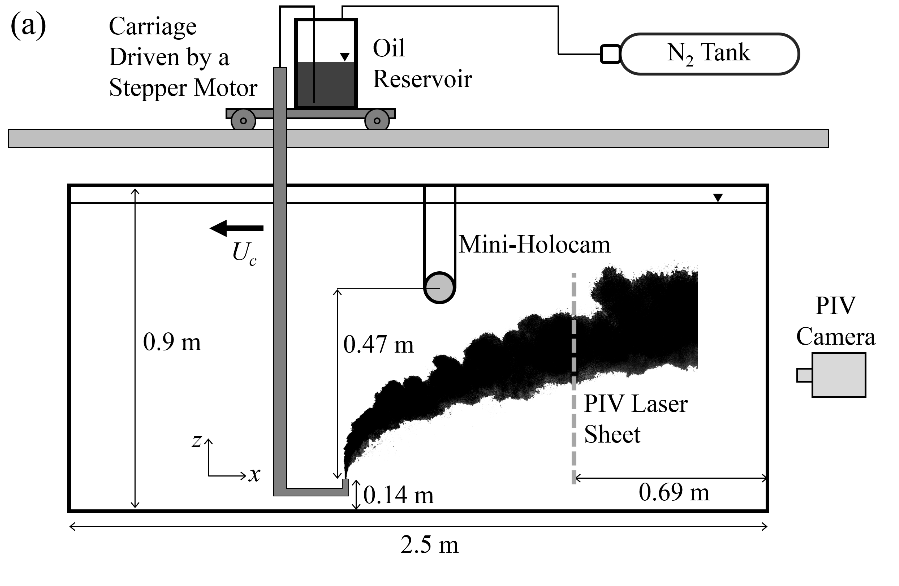 Experiment facility setup
Facility
The towing tank facility includes a 500 gallon acrylic tank and a stepper motor-controlled carriage with speeds from 1-200 mm/s. The 2.7m x 1m x 1m tank is enclosed except for a slit for inlet pipe, connecting to a 3D-printed injection nozzle that has a polished, cosine-shaped, converging interior surface, leading to a d=4 mm diameter orifice. The tank is filled with artificial seawater (Instant Ocean) with a salinity of 33 ppt and density ρ=1018.3 kg/m3.
Experimental Factors
Experiments have been conducted with crude oil alone, which is defined as the control case, and with crude oil-dispersant (Corexit 9500A) mixtures at dispersant to oil ratios (DOR) of 1:100 and 1:25. A plume visualization experiment also is conducted by injecting a dyed, miscible solution of 20% glycerol and 80% isopropanol, which closely matches the viscosity and density of the crude oil.
Three types of experiments have been conducted.
- High-speed visualization
- Submersible digital inline holography
- Velocity measurement using PIV
In the first, a high-speed camera (pco.dimax) equipped with a 28 mm lens (Nikon Nikkor) operating at 250 fps is used to visualize the large-scale plume behavior.
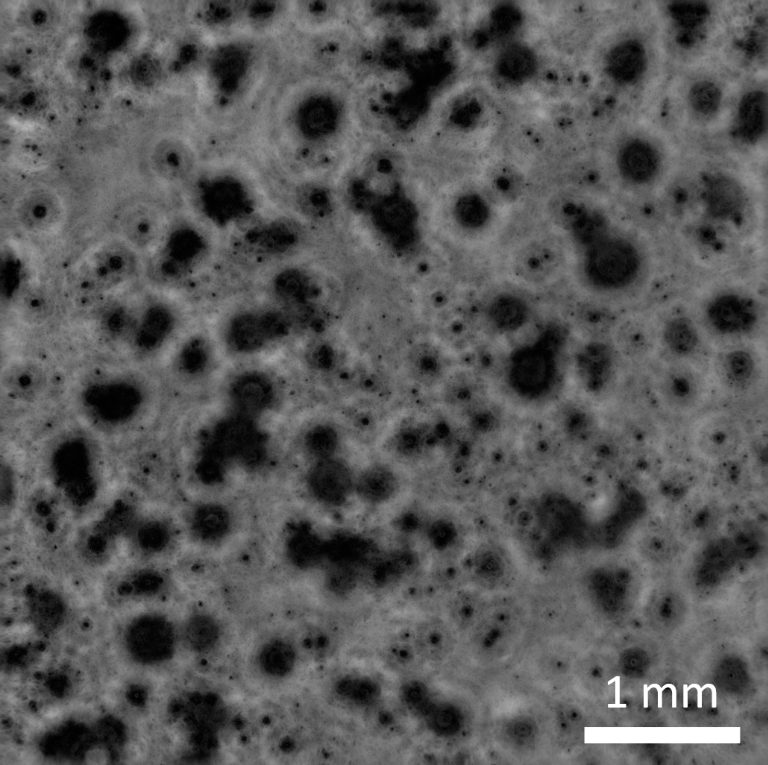
The second experiment consists of application of digital inline holography to measure the droplet size distributions within the oil plume. These measurements are synchronized with high speed imaging in order to relate the measured droplet sizes to the location and evolution of the large-scale plume. The present digital holograms are recorded by the ‘Mini-Holocam’ (Figure 1c), a custom-built, submersible inline holography system, which is suspended in the tank in order to record data at high magnification within the opaque plume.
Using available in-house codes, the holograms are processed to obtain in-focus images of the droplets in a series of parallel planes across the sample volume.
The PIV measurements are carried out for the crude and 1:100 DOR oils. PIV is used to characterize flow structures in a fixed jet cross section plane located 69 cm from the tank end from which the nozzle begins its travel.
The initial data analysis phase consists of separating the images into zones where the seed particles are visible, regions containing both particles and in-focus oil droplets, and areas obscured by out-of-plane oil droplets, which appear as a black cloud. In regions with useful data, out-of-plane and large in-plane droplets are removed using a median filter. The remaining portions are enhanced using Modified Histogram Equalization, and the velocity is calculated using an in-house cross-correlation-based algorithm.
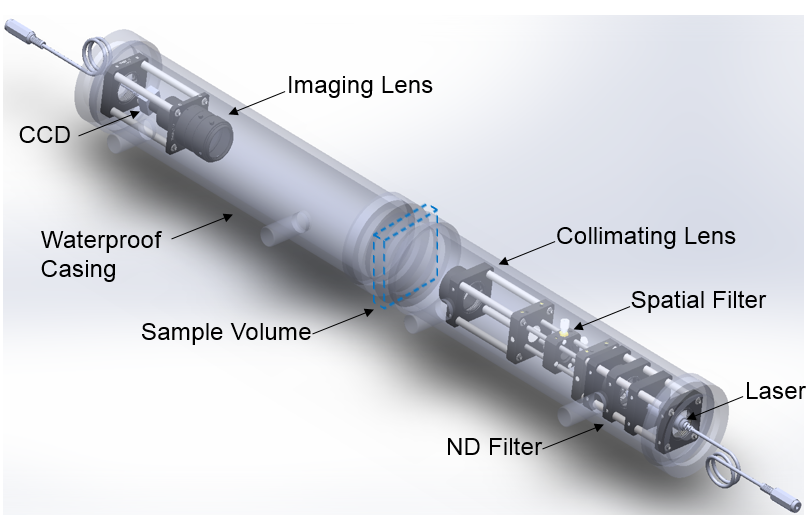
Submersible In-line Holographic Camera
Results
Overall flow structure: In all cases, the jet is injected vertically and is bent over by the crossflow, with the oil and oil-dispersant jets breaking up into droplets. The decrease in droplet sizes with increasing dispersant concentration is evident from the complete views and is highlighted in the insets.
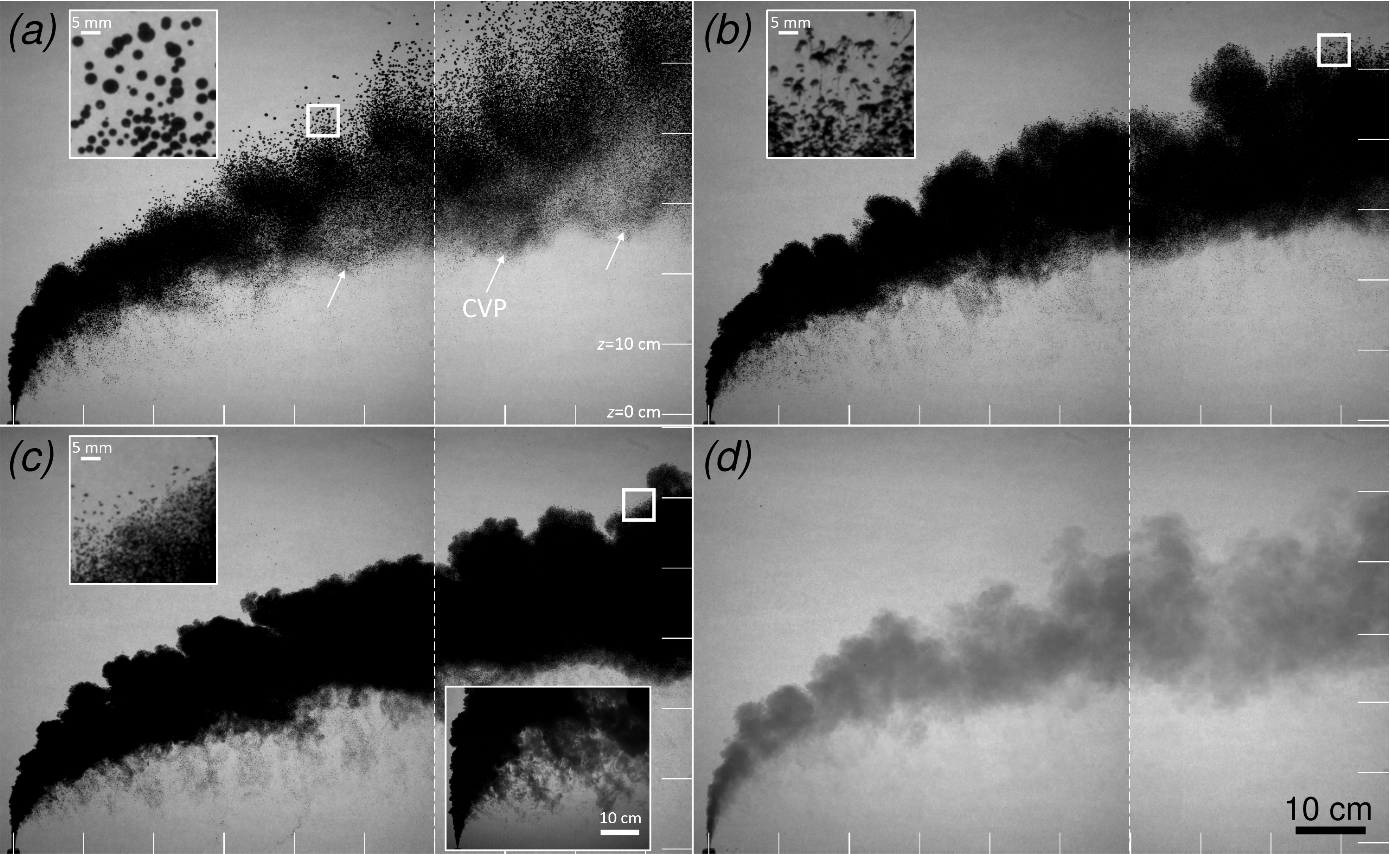 (a) No dispersant (control) (b) 1:100 DOR (c) 1:25 DOR (d) Crude oil analog
The high speed videos also show that some of the droplets near the bottom boundary of the plume reside in largely horizontal vortices, which as subsequent data show, is the counter rotating vortex (CVP).
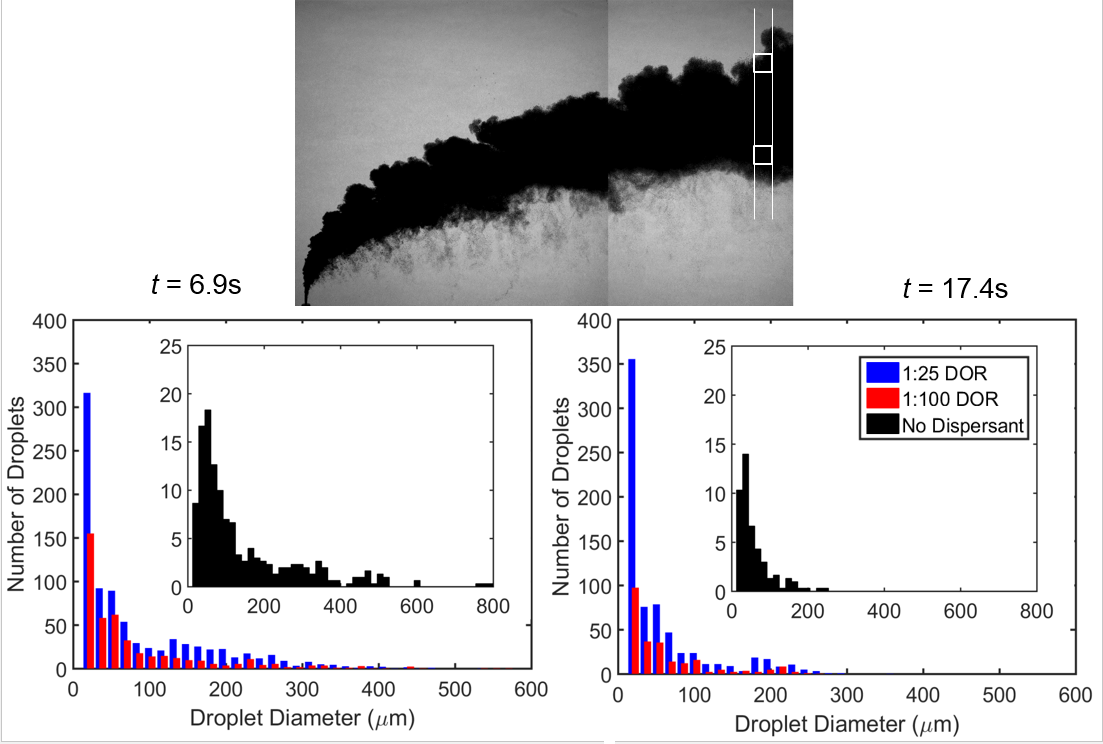
Droplet Size Distributions: Figure below compares sample droplet size distributions for the crude, 1:100 DOR, and 1:25 DOR plumes in the first Mini-Holocam position. These data are recorded as the plume bulk, in particular the space between CVP vortices, rises through the tank centerline.
The total number of droplets increases, but the fraction of large droplets and the size of the most abundant droplets decrease substantially with increasing dispersant concentration. Figure below shows the time evolution of the droplet size distribution at two different time points and for 3 different cases: Control, 1:100DOR and 1:25 DOR.
 Measurements of CVP Characteristics: Figure below shows sample instantaneous velocity distributions superimposed on the original PIV images at four times (out of 783) for the crude oil plume.
The peak speeds between the CVP decreases to ~55 mm/s, and the velocity along the outer edge of the plume at a similar elevation is in the 20-25 mm/s range. By t=12 s, the vortices have further risen and spread apart, with the right vortex no longer in the field of view, and the peak speed decreases to ~30-40 mm/s. At t=16 s, the motion of the left vortex has slowed, though it continues to drift outward and upward over the next several seconds.
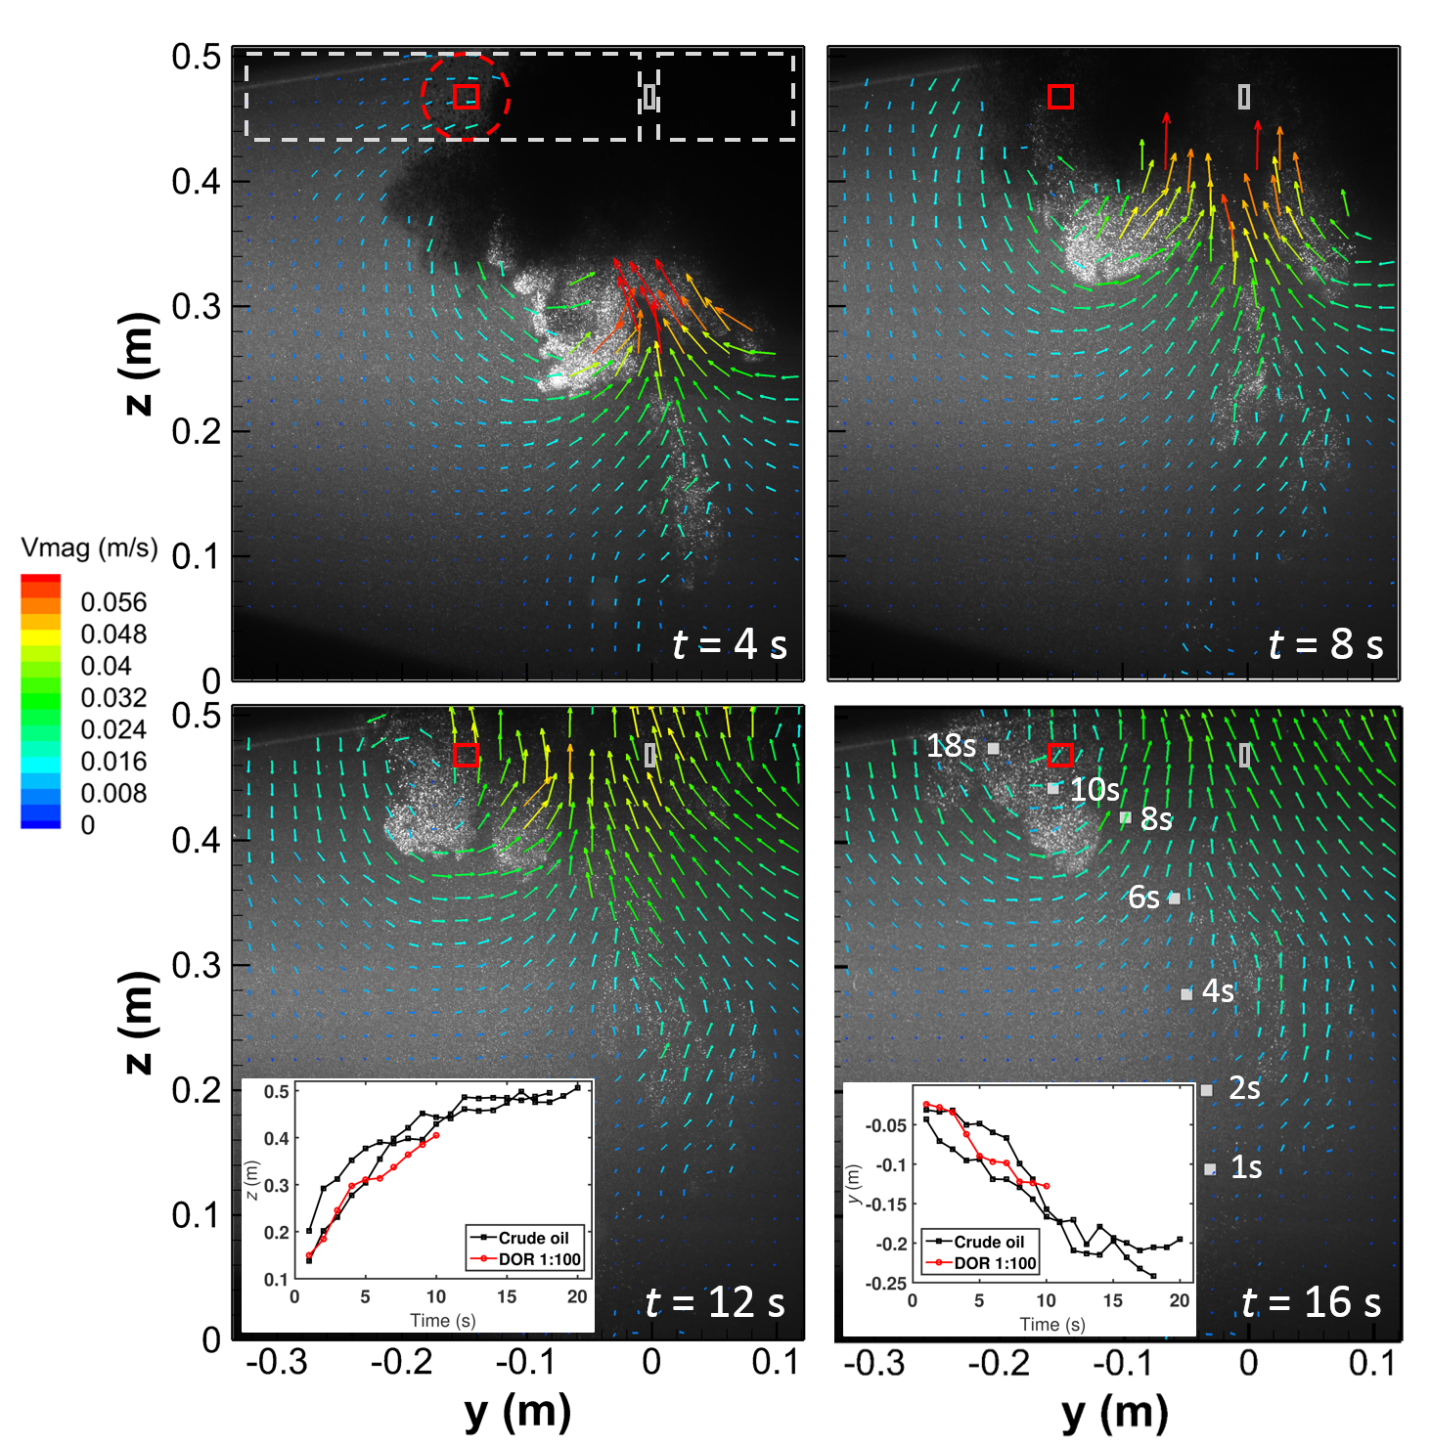 Samples from time series showing a superposition of PIV images and
velocity vectors calculated from them for the crude oil plume.
Analysis and Discussion
Analysis of plume height and boundaries for the oil, oil-dispersant, and miscible analog plumes allows us to link the measured plume velocity fields and droplet sizes to the large scale plume behavior.
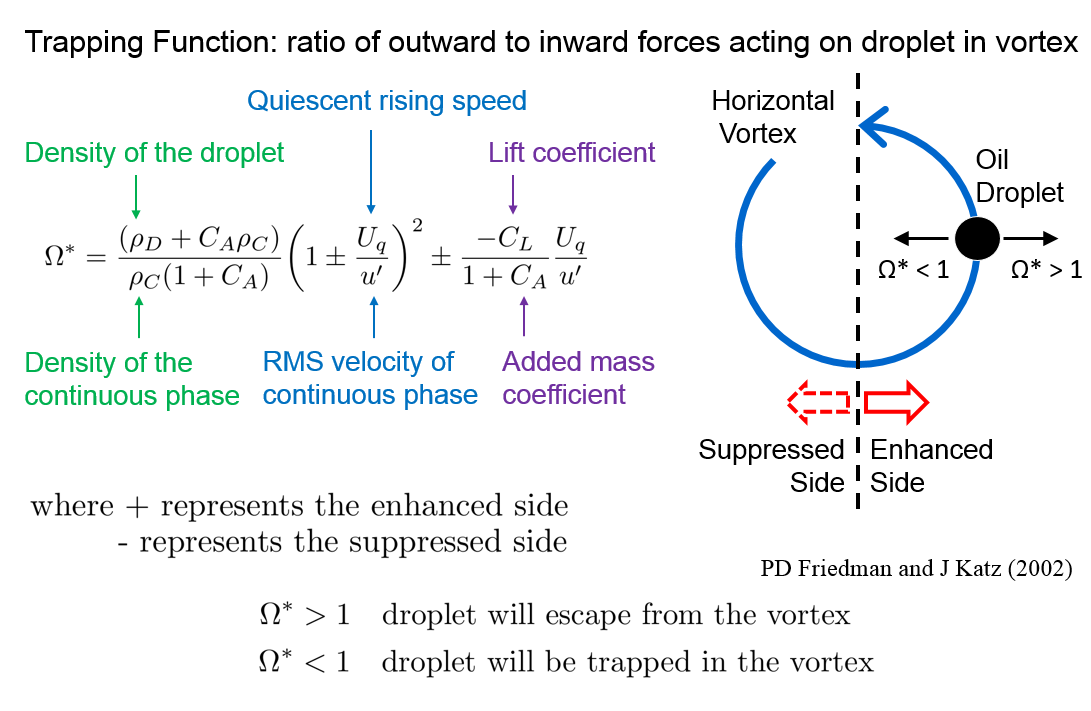 Trapping function developed by Friedman & Katz (2002) was implemented to estimate the ability of the counter rotating vortex pair to trap oil droplets of certain sizes.
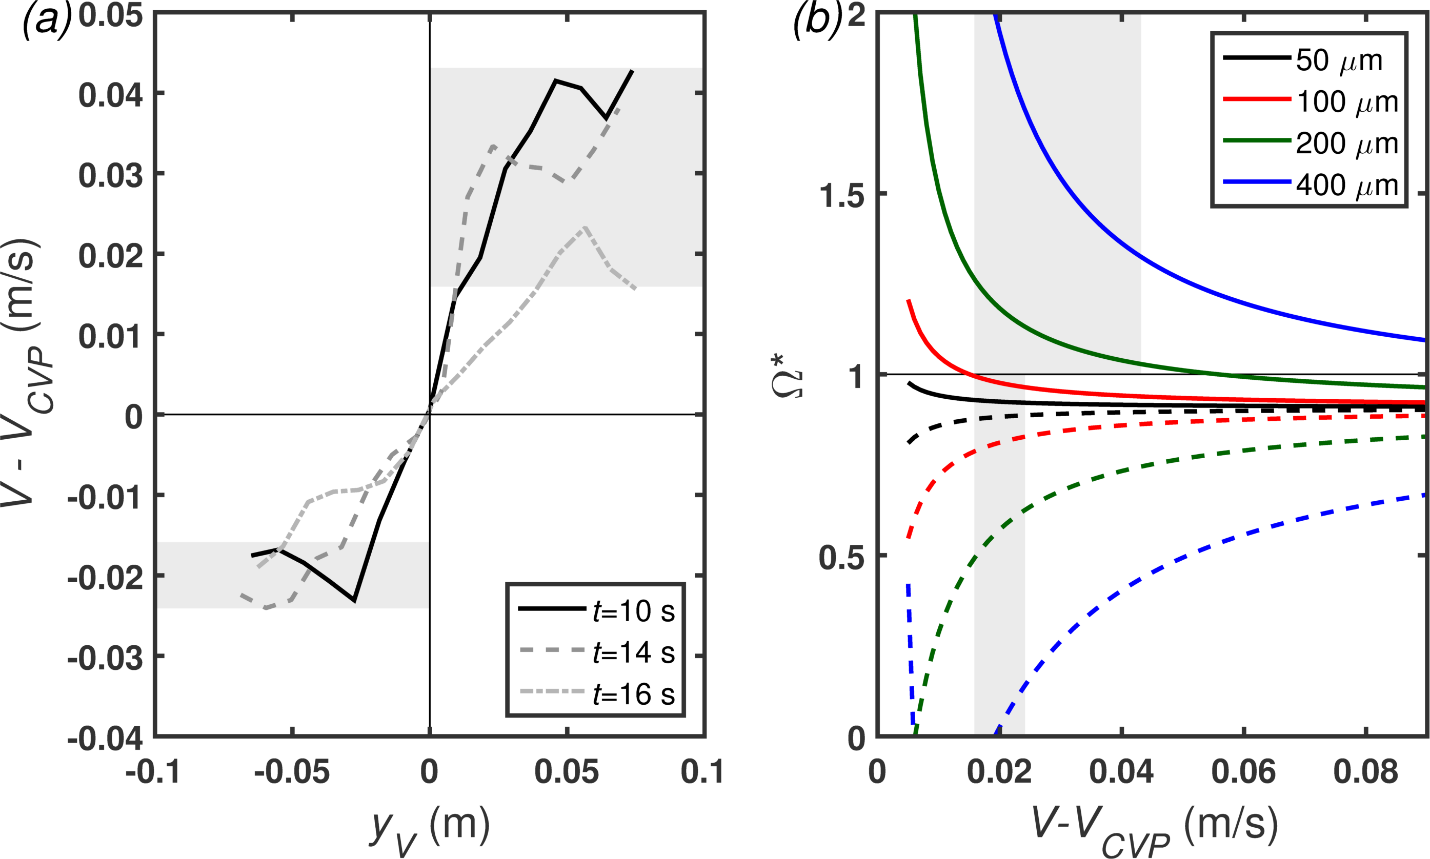 a) Profiles of vertical velocity V-VCVP through center of left vortex of CVP at t=10, 14, and 16 s, where yV = 0 m is the core center. Shaded areas correspond to characteristic vortex velocities on the plume boundaries; b) Trapping function Ω* as a function of V-VCVP for droplets located on upward (solid lines) and downward (dashed lines) sides of vortex, for four characteristic droplet sizes. Shaded areas correspond to the same characteristic vortex velocities on the vortex boundaries.
Figure above shows that all of the four characteristic droplet sizes remain trapped in the vortex when on its downward side. On the upward side, however, the 400 μm droplet escapes and the 50 μm droplet remains trapped for the entire range of velocities around the vortex at t>10 s. A 200 μm droplet would not escape until the vortex induced velocity decreases to 0.056 m/s, and the 100 μm droplet would remain trapped until the speed falls below 0.015 m/s. Hence, the trapping function can be used to predict the maximum droplet size that would be retained within the CVP. For upward velocities in the 0.016 to 0.043 m/s range, the corresponding maximum retained droplet sizes are 114 and 192 μm. The statistics of droplets trapped within the CVP at t=10.4 s (Figure 6) show that 95% of the droplets are smaller than the predicted maximum diameter of trapped droplets. At t=17.4 s, 99% are smaller than the predicted maximum diameter. It appears that the trapping function provides the correct estimate of droplets retained by the CVP.
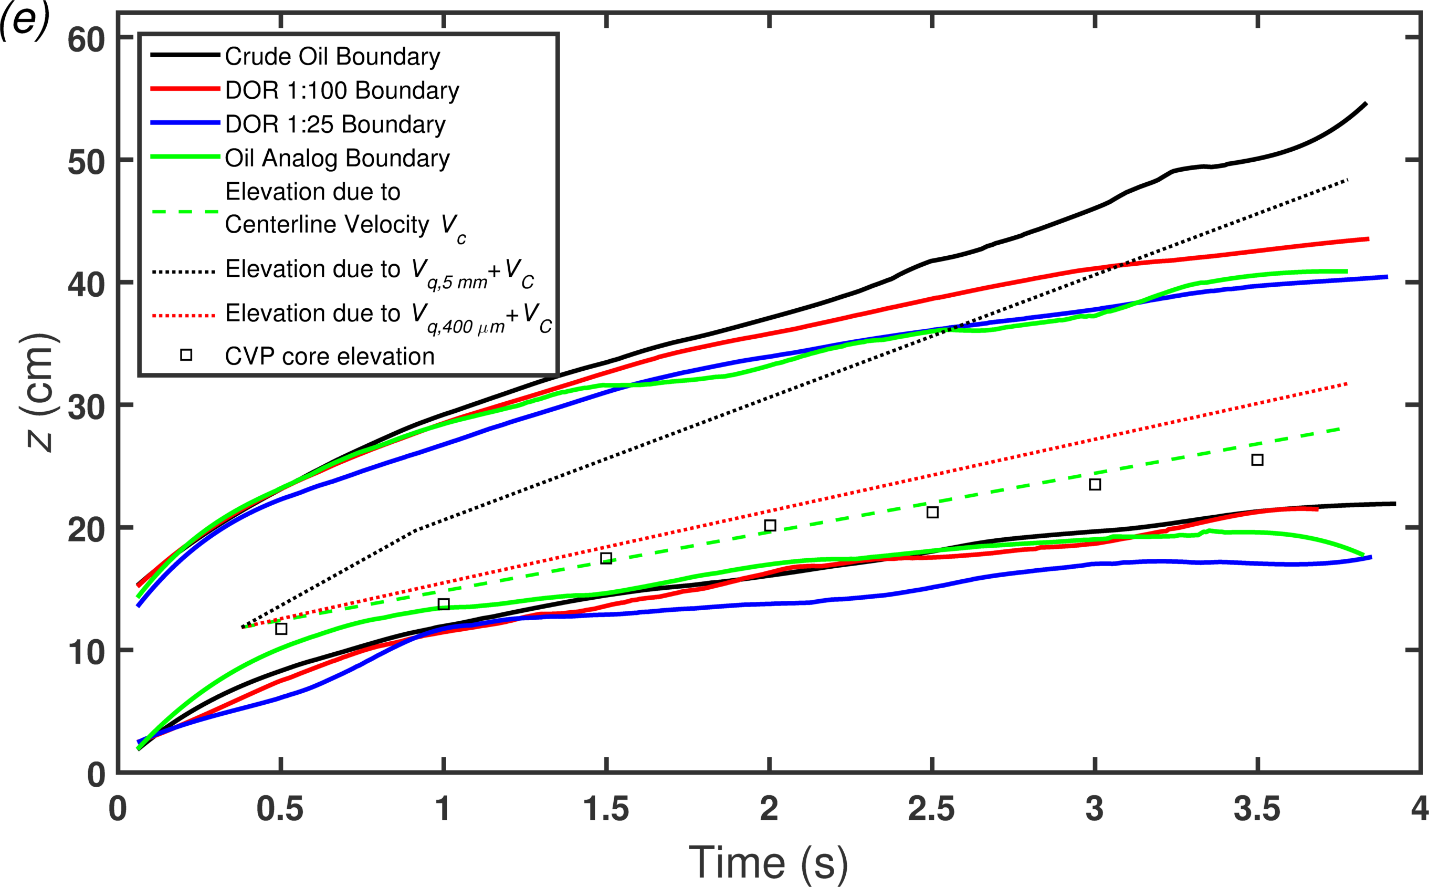 Temporal variations in mean plume boundaries, CVP core elevation, and elevation
due to Vc. Elevations of sample 5 mm and 400 μm droplets rising by Vq and Vc
(while within the CVP) are also shown over time.
Summary
- Crude oil plumes in crossflow generate a counter-rotating vortex pair and wake vortices underneath the plume which significantly affect the spatial distribution of oil droplets.
- Chemical dispersant mixed with crude oil plumes generate dramatically smaller droplets which become entrained in large-scale vortex structures.
- The size of droplets trapped by the counter-rotating vortex pair is predicted correctly using a trapping function, which is based on a balance of forces on droplet located within a horizontal eddy.
Publications
Chandrala, L. D., Afshar-Mohajer, N., Nishida, K., Ronzhes, Y., Sidhaye, V. K., Koehler, K., & Katz, J. (2019). A Device for measuring the in-situ response of Human Bronchial Epithelial Cells to airborne environmental agents. Scientific reports, 9(1), 1-12.
Sampath, N. A. Mohajer, L. Chandrala, W. Heo, J. Gilbert, D. Austin, K. Koehler, and J. Katz., (2019). Aerosolization of crude oil‐dispersant slicks due to bubble bursting. Journal of Geophysical Research: Atmospheres, 124(10), 5555-5578.
Li, C., Miller, J., Wang, J., Koley, S. S., & Katz, J. (2017). Size distribution and dispersion of droplets generated by impingement of breaking waves on oil slicks. Journal of Geophysical Research: Oceans, 122(10), 7938-7957.
Murphy, D. W., Xue, X., Sampath, K., & Katz, J. (2016). Crude oil jets in crossflow: effects of dispersant concentration on plume behavior. Journal of Geophysical Research: Oceans, 121(6), 4264-4281.
Murphy, D. W., Li, C., d’Albignac, V., Morra, D., & Katz, J. (2015). Splash behaviour and oily marine aerosol production by raindrops impacting oil slicks. Journal of Fluid Mechanics, 780, 536-577.
Murphy, D., Morra, D., & Katz, J. (2013). Rain Drops and Oil Slicks: Impact of Water Droplets on a Surface Oil Layer. 66th Annual Meeting of the Division of Fluid Dynamics, Bulletin of the American Physical Society, 58.
Katz, J., Murphy, D., & Morra, D. (2013). Large Scale Behavior and Droplet Size Distributions in Crude Oil Jets and Plumes. 66th Annual Meeting of the Division of Fluid Dynamics, Bulletin of the American Physical Society, 58.
Li, C., Holser, A., & Katz, J. (2013). Breakup of an oil slick mixed with dispersants by breaking wave. 66th Annual Meeting of the Division of Fluid Dynamics, Bulletin of the American Physical Society, 58.