People
| Graduate student | Zeng Zhang |
| Project Supervisor | Prof. Joseph Katz |
| Project Collaborator | Prof. Dan Choi (JHMI), Dr. Xun Zhou (JHMI) |
Introduction
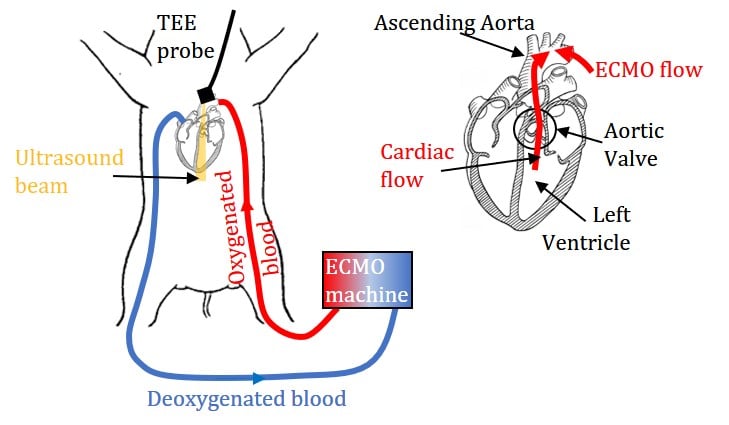
Figure. 1 Sketch of V-A ECMO system
Veno-arterial extracorporeal membrane oxygenation (VA-ECMO) is a salvage therapy that provides patients with both respiratory and circulatory support by draining blood from the venous system, oxygenating it outside the body, and returning it retrogradely to the arterial system. The most commonly applied configuration is femoral-femoral VA-ECMO, in which the arterial flow to the patient is retrograde via the femoral artery. It has been widely applied to patients with cardiogenic shock, severe cardiac failure, and chronic cardiomyopathy. However, determining the optimal VA-ECMO flow rate (QE) is challenging. High QE is favorable for adequate end-organ perfusion. Nonetheless, it has been proposed that retrograde arterial flow may increase the afterload to the heart. Consequently, the metabolic work demand on the myocardium might increase, hindering myocardial tissue recovery. Clinical management relies on monitoring the hemodynamic states, but outcomes of the therapy are influenced by the patient- and treatment-related factors. Insights regarding the interactions between ECMO flows and native cardiac output at the admixing zone may lead to quantitative assessment of the impact of the afterload created by the retrograde arterial flow.
This project uses the optimized echo-PIV/PTV to characterize the interactions between ECMO flow and native cardiac output in the aortic root of a Yorkshire pig with severe myocardial ischemia. The instantaneous and phase-averaged velocity distributions are analyzed to elucidate the effects of the ECMO flow rate on the flow patterns, as well as the duration and magnitude of cardiac outflow.
Results
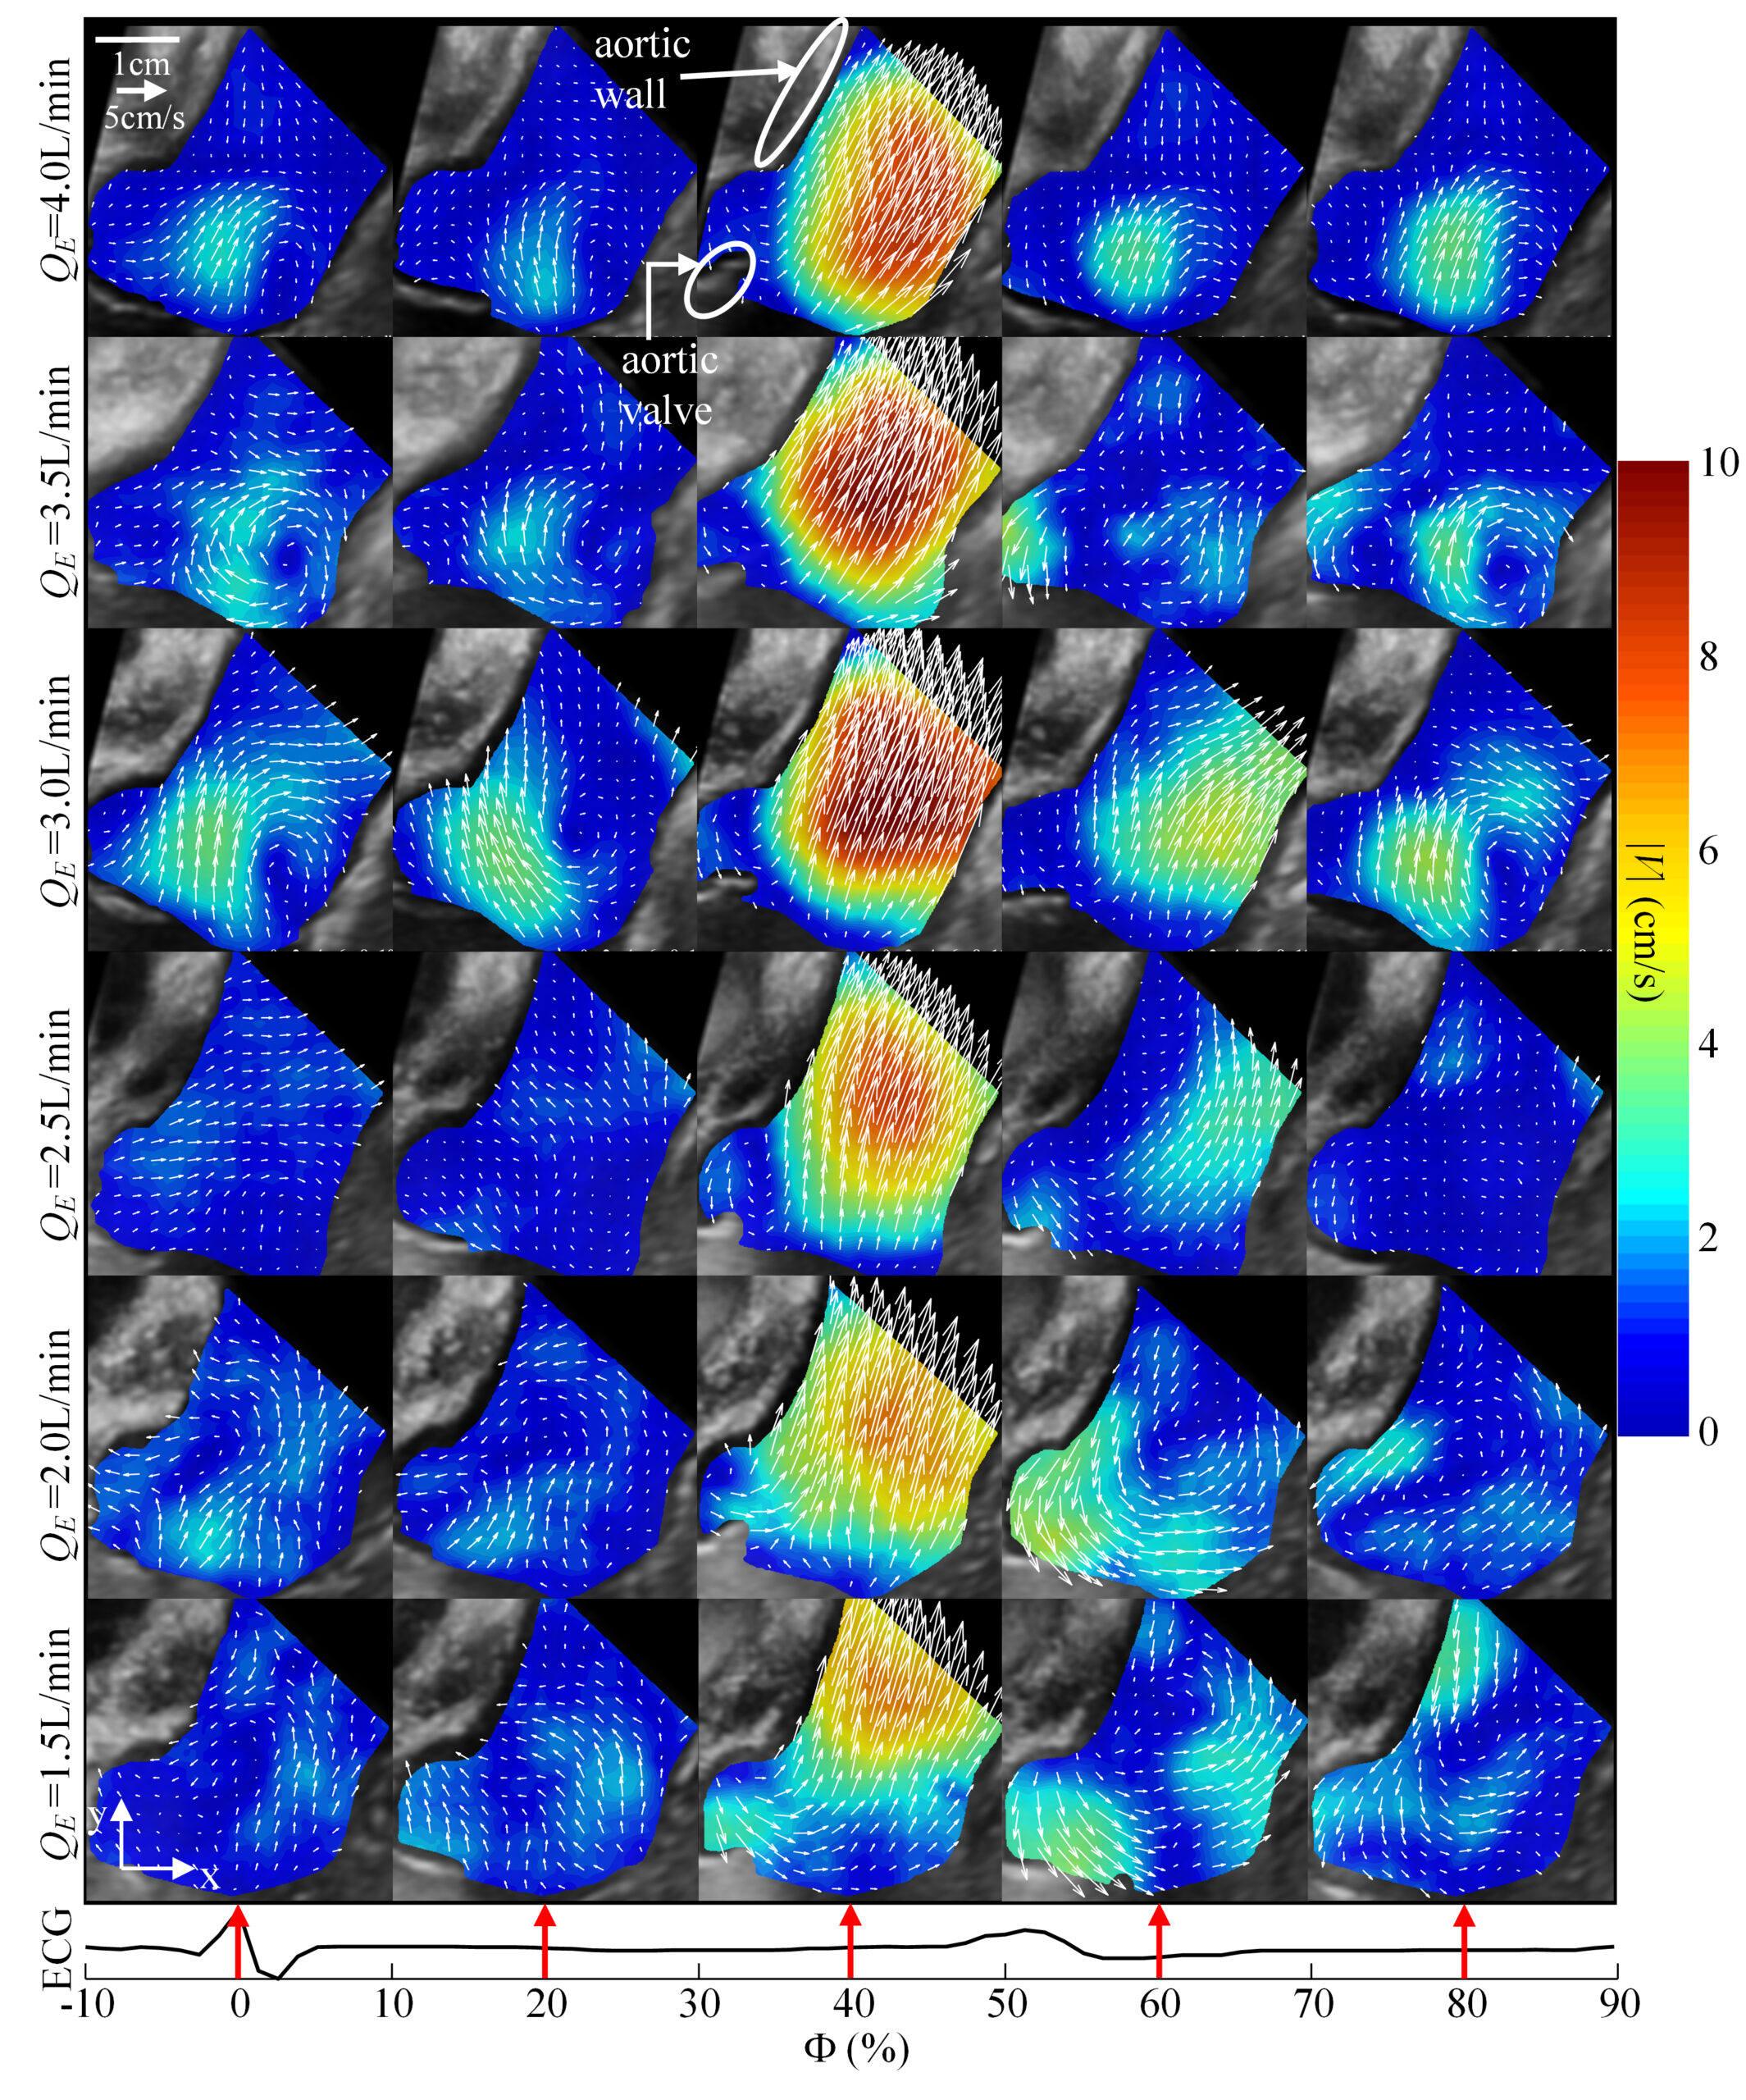
Figure. 2 Vectors and contour maps of the phase-averaged velocity magnitude (|V|) for varying ECMO flow rates (rows) and phases in the cardiac cycle (columns).
Figure 2 shows the phase-averaged velocity for five selected phases of the cardiac cycle for all the present values of QE. The selected phases (Φ) are specified as a percentage of the cardiac cycle, starting from the R wave peak of the ECG. As is evident, the jetting during systole (Φ~40%) strengthens as QE is decreased from 4.0 to 3.0L/min, but then decreases with further reduction of the flow rate. During diastole, prominent secondary flows consist of a clockwise vortex in the sinus at QE≥3.0L/min, and a counterclockwise vortex above the sino-tubular junction at lower QE.
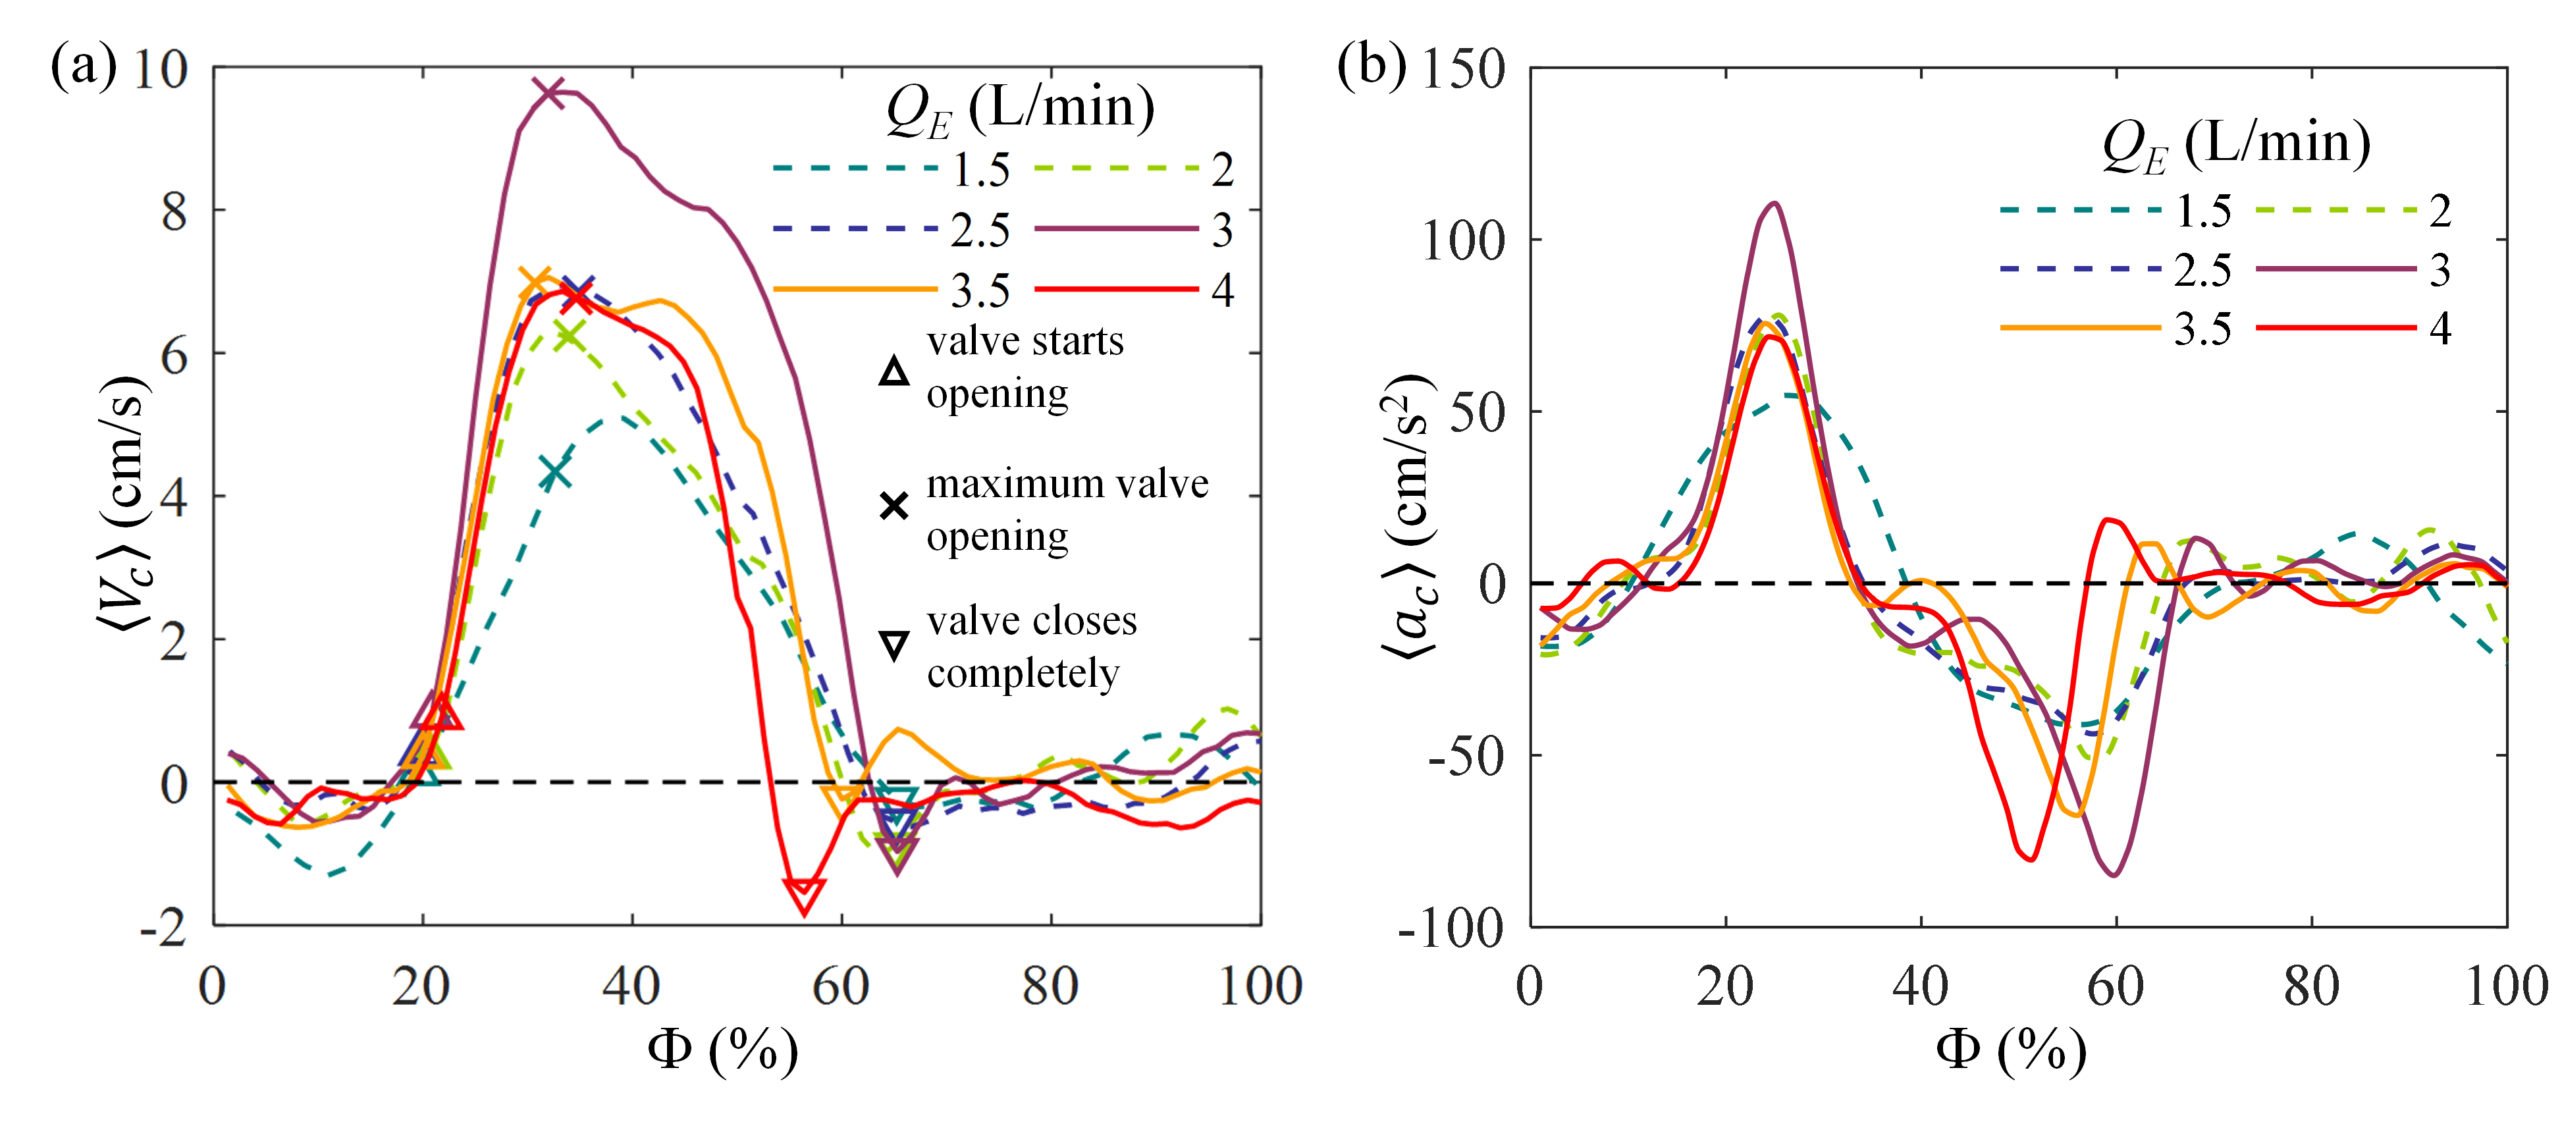
Figure. 3 Phase evolution of (a) the spatially averaged velocity and (b) acceleration
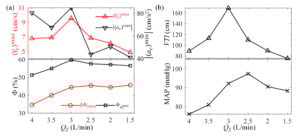
Figure. 4 Variations of (a) maximum velocity, maximum deceleration magnitude, the phase interval between valve opening and closing (ΔΦopen), phase of the maximum deceleration, and (b) velocity-time integral (VTI) over 1min calculated, and MAP during image acquisition with ECMO flowrate.
Two flow rate regimes are identified: For QE≥3.0L/min, the maximum velocity, phase of peak deceleration, duration with open valve, MAP and VTI increase with decreasing flow rate, peaking at QE=3.0L/min, suggestive of sufficient ECMO support. Conversely, for QE≤2.5L/min, as the ECMO flow rate is reduced, the peak velocity, MAP and VTI decrease, while the phase of peak deceleration and duration with open valve plateau during systole. The deceleration during the transition to diastole is much milder in this range. Since the recommended optimal veno-arterial ECMO flow rate should be the lowest level that maintains adequate tissue perfusion, QE=3.0L/min appears to be the optimal flow rate for the particular physiological condition for this study.