Dataset and Selected Filter Scales
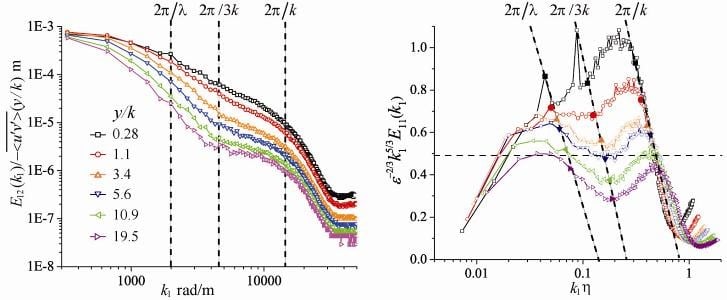
- A decrease of slope magnitude with increasing distance from the wall occurs at wavelength in 1-3k range.
- Turbulence at scales larger than l has tended towards inertial-range behavior.
- Outside of the roughness sublayer, there are clear troughs between the peaks in the compensated spectra that seem to fall approximately at wavenumber corresponding to 3k.
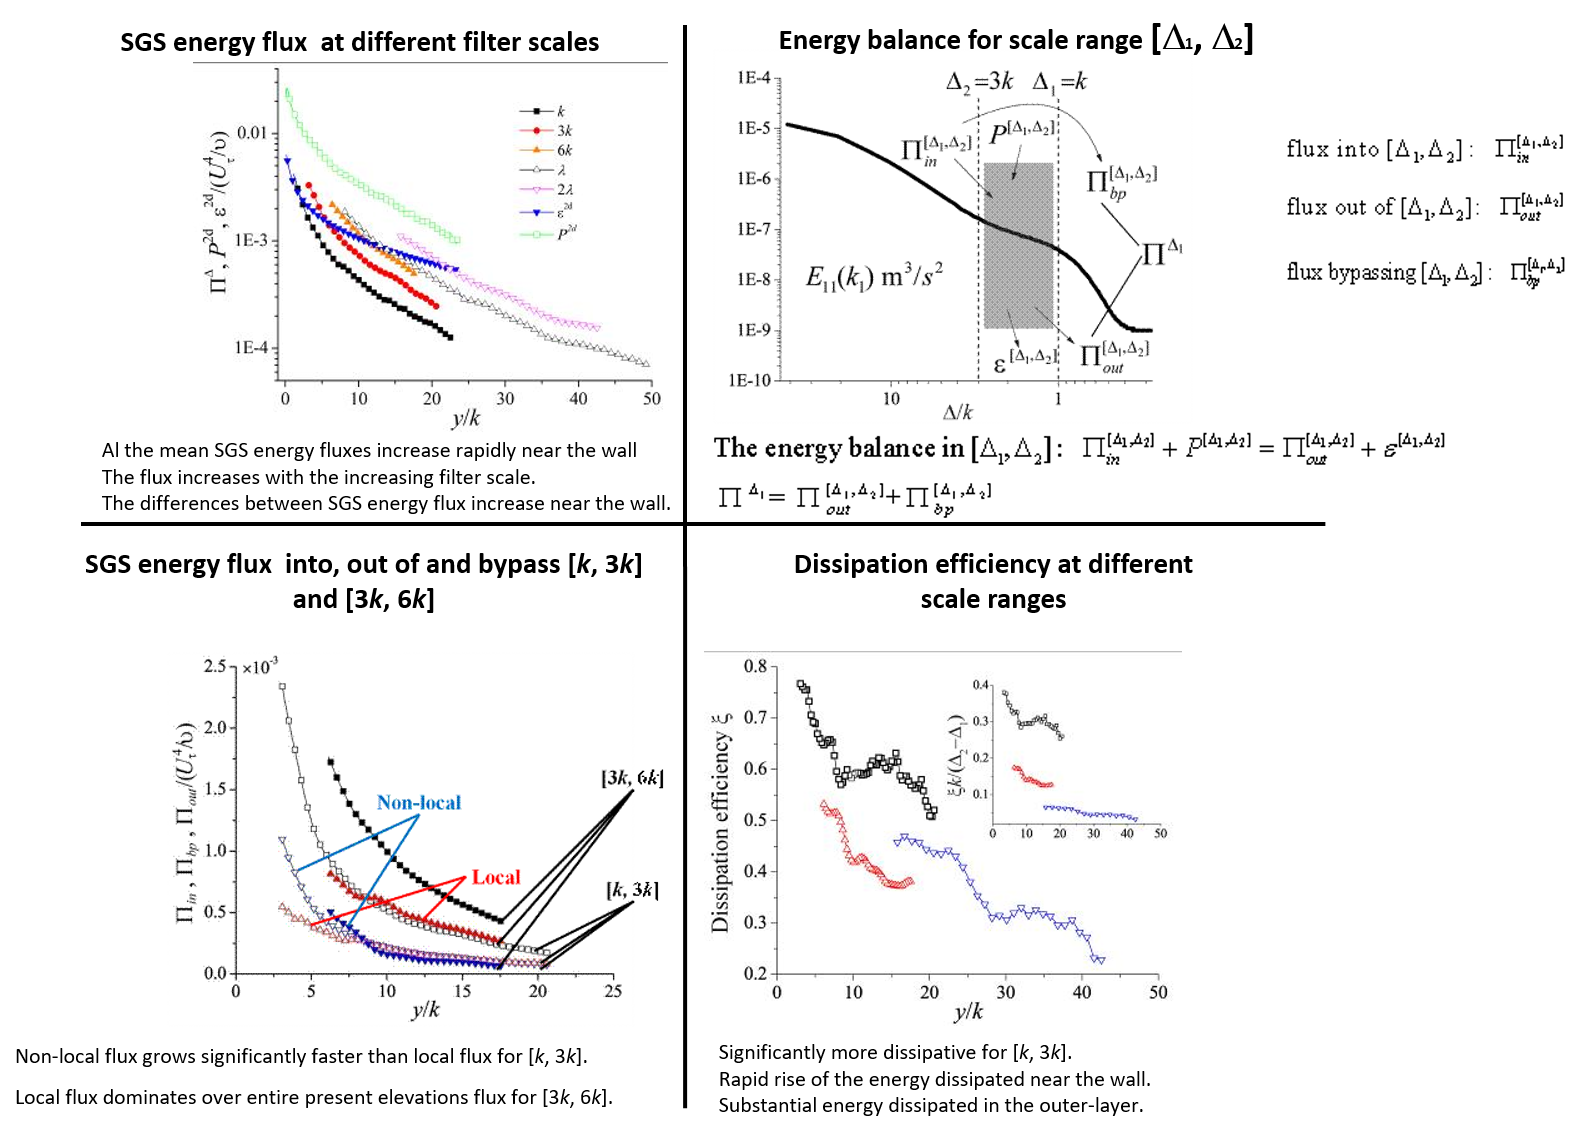
2D tophat-filter of size D=1k, 3k, and 6k are applied to divide flow field into:
- Sub roughness-scale range-scales smaller than k
- Roughness-scale range-scales within [k, 3k]
- Intermediate scale range-scales within [3k, 6k]
- Large scale range-scales larger than 6k.
 Mean SGS Turbulence Quantities
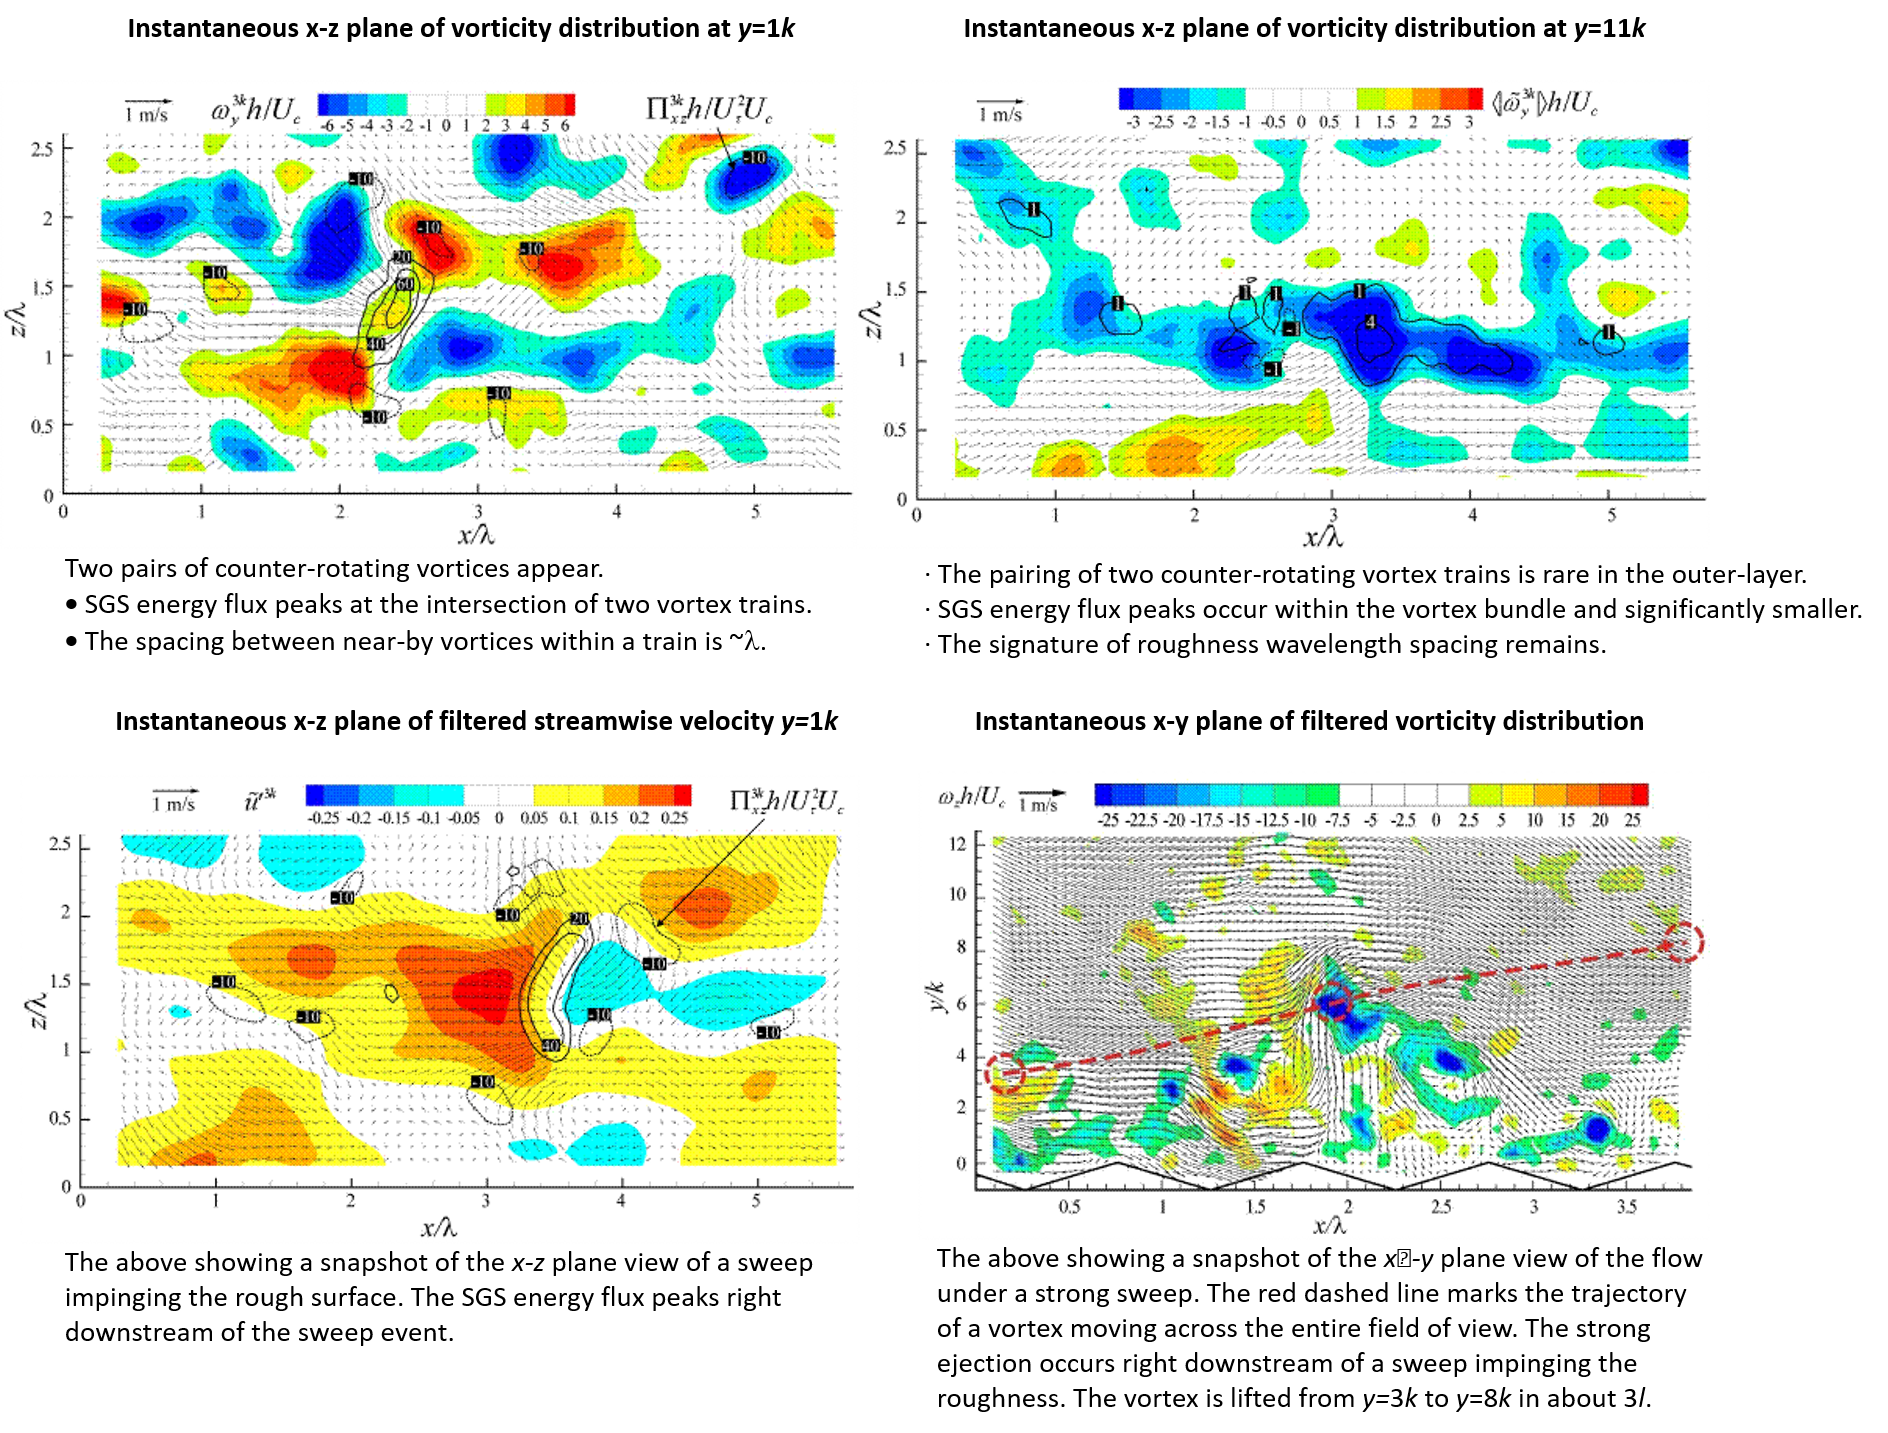
Coherent structures associated with the significant SGS energy flux
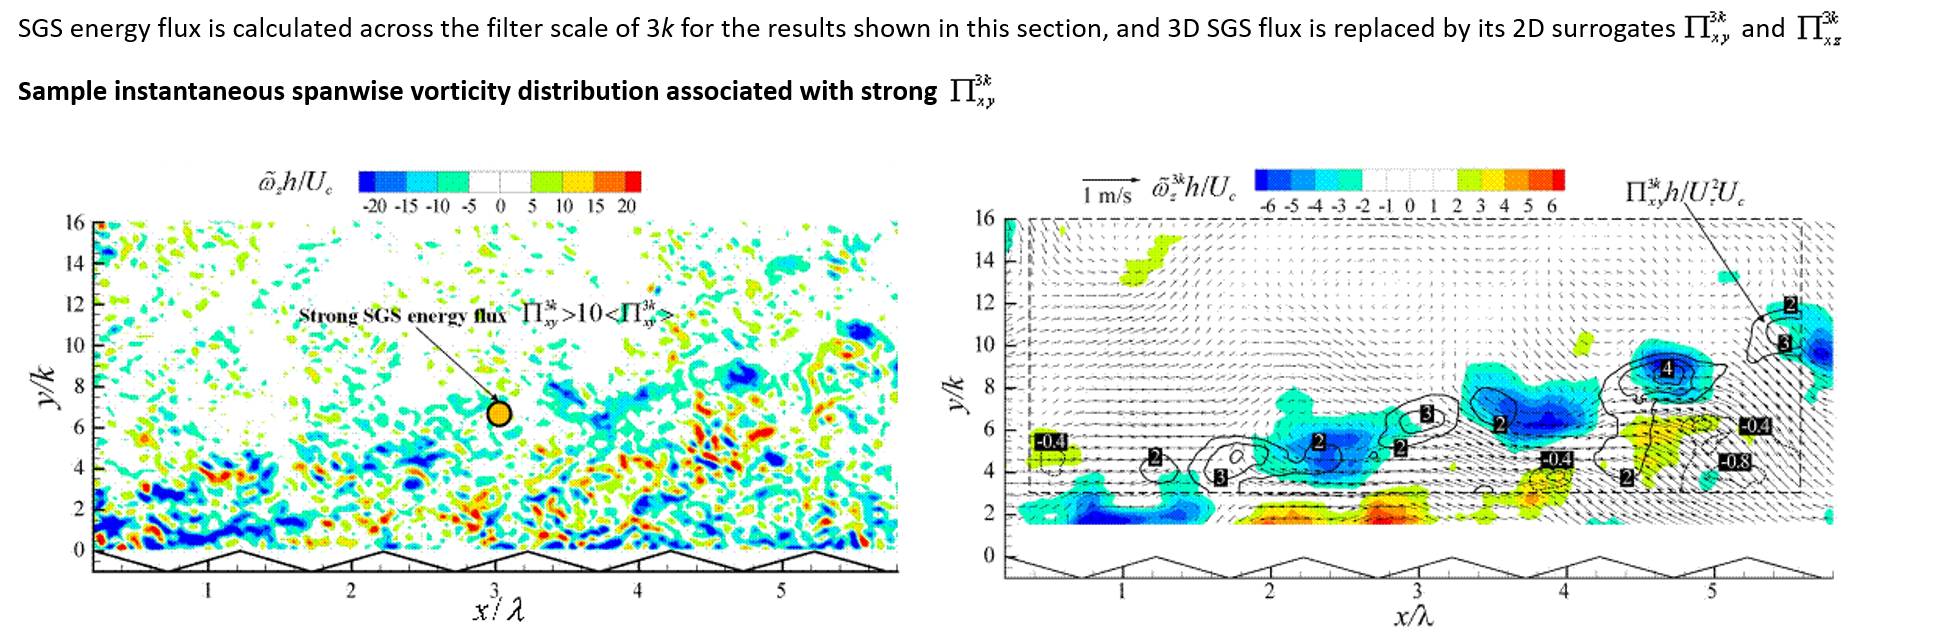
- Large scale inclined train consisting of vortices with wz<0, separated by roughness wavelength. Rapid rise of the energy dissipated near the wall.
- Strong ejection below and sweep above SGS flux peak.
- SGS energy flux peaks within the vortex train.
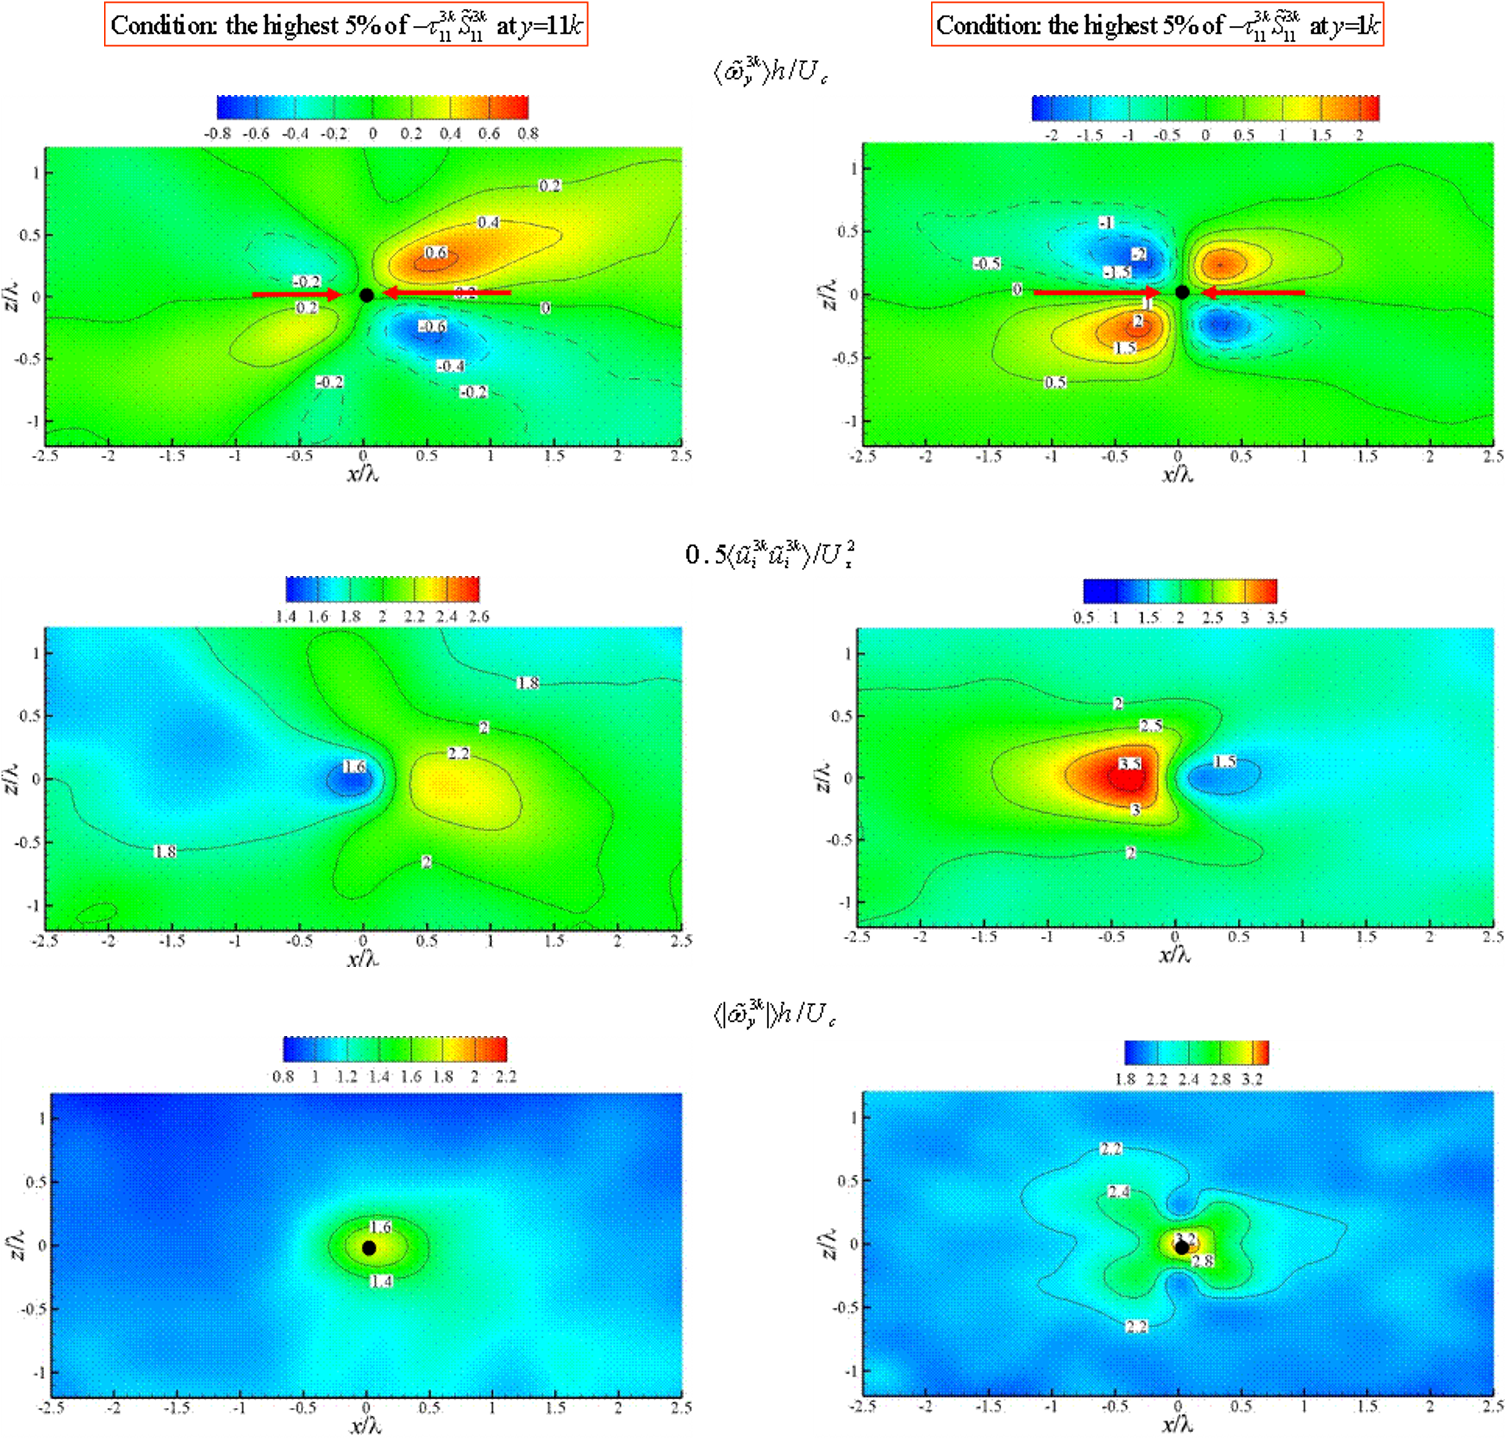
Conditionally-averaged distributions
![]()
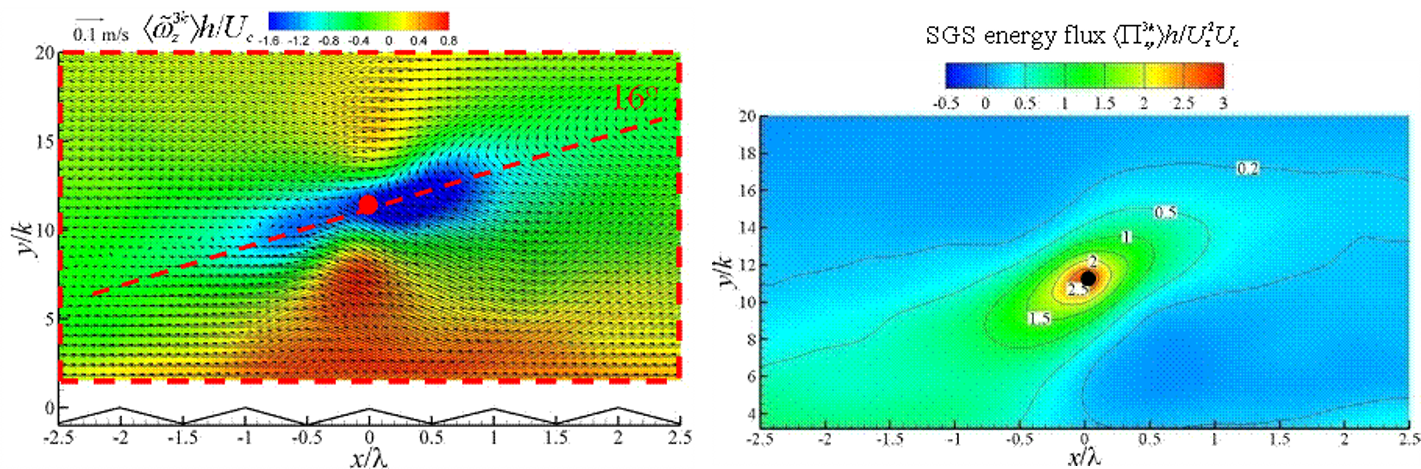
- Large scale inclined shear layer.
- Strong ejection below and sweep above SGS flux peak.
- Inclined region of high SGS energy and flux (inclined at a different angle).
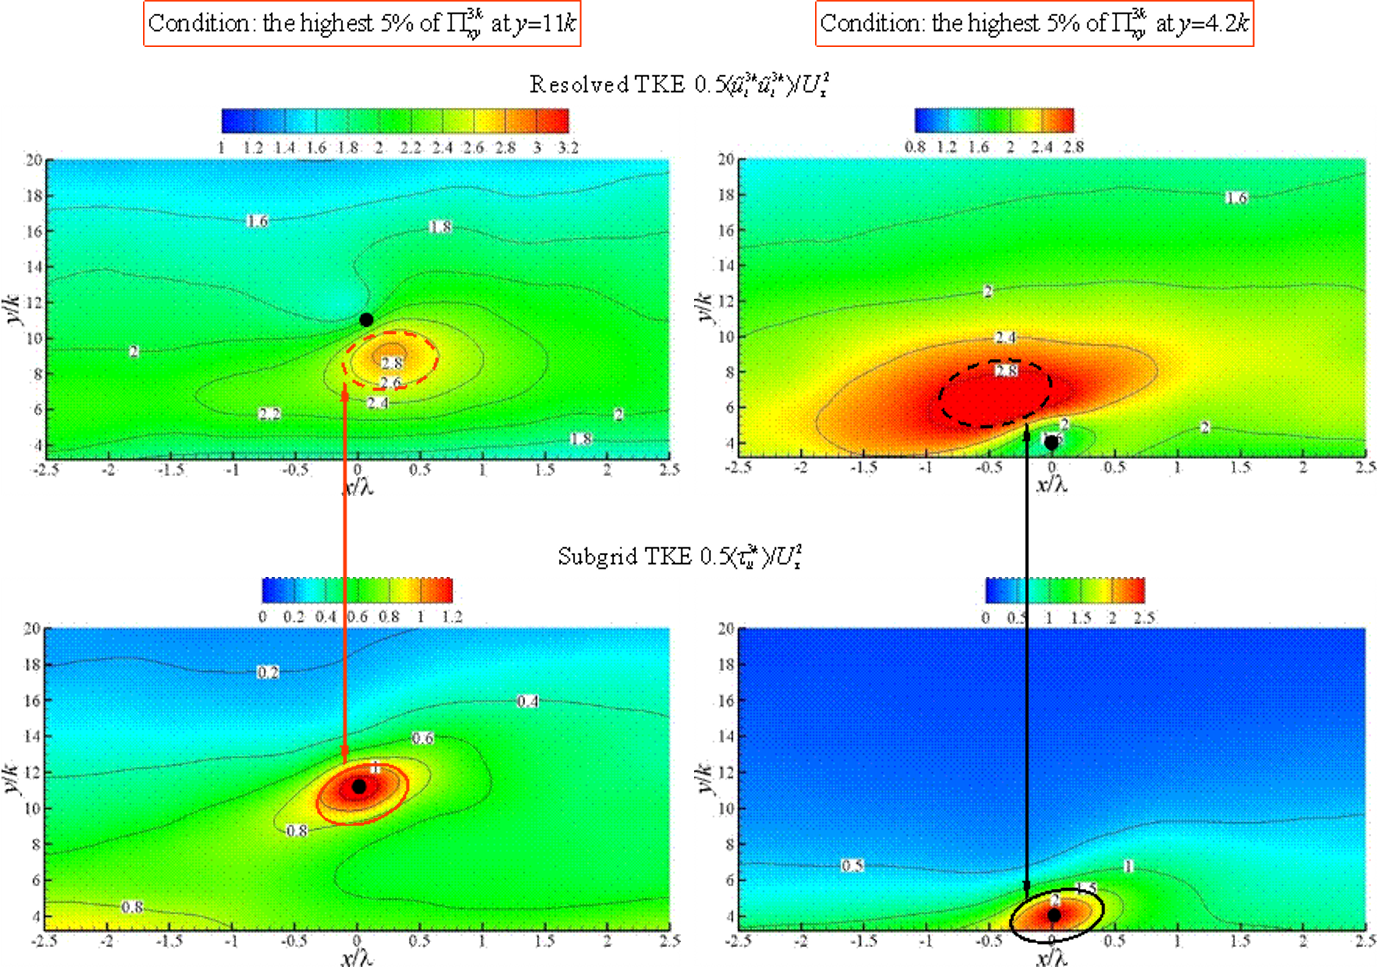
- Resolved TKE peaks in the sweep region near-wall and ejection region at higher y.
- Resolved and subgrid TKE do not peak in the same location.

-
- Two pairs of counter-rotating vortices both near-wall and in the outer-layer.
- Dominant resolved flow: sweeps near the wall, and ejection away from it.
- The cross pattern of voriticity magnitude appears only near the roughness.
Evidences from the time-resolved measurements
The left plot shows the probability density function (PDF) of minimum distance between vortices of opposite signs. It has a peak of 0.35l at y=1k. The vortices are identified based on the unfiltered swirling strength, thresholded to remove the peaks with the lowest 10% values (presumed to be noise), and structures with size lower than k (k/l≈0.16). With increasing elevation, the PDF broadens, and the most probable value increases to 0.5l at y=11k. These trends indicate that although we can no longer observe pairs of counter-rotating vortex trains at y=11k, the signature of the rough surfaces persists in the turbulence structure well above the roughness sublayer, consistent with the picture depicted by the energy spectra. At this elevation, the integral scale is already larger than l, yet, the roughness signature does not disappear.
Physical mechanism involved with generation and transport of coherent structures.
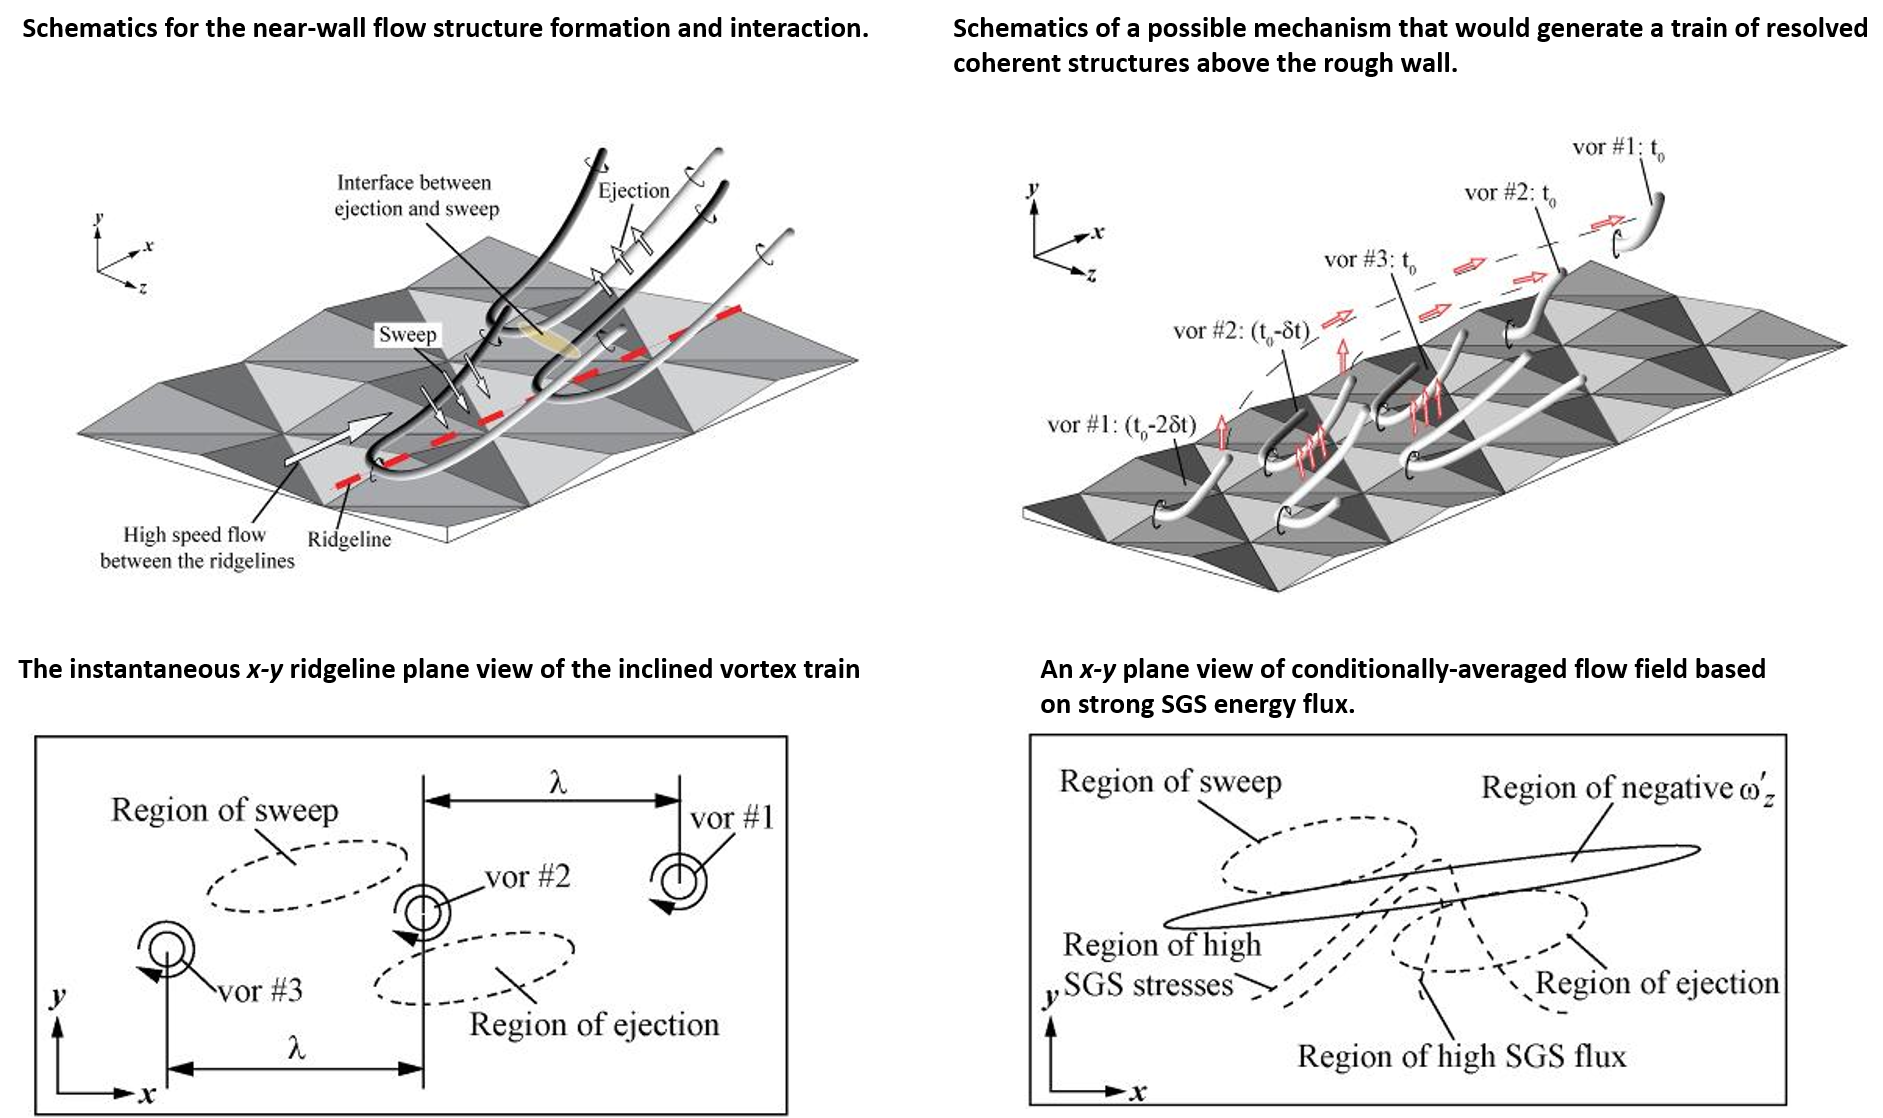
The formation of the ‘U’ shape or quasi-streamwise vortical structure is supported by 3D holographic PIV measurements. This structure is generated as spanwise vorticity produced on the rough surface wraps around the roughness elements and stretched in the streamwise direction by the faster flow between the elements.
The presence of multiple U shape structures might generate the intersecting pattern of counter-rotating vortices as well as the sweep-ejection interface observed in the x-z plane instantaneous and conditionally-averaged distributions. The contracting flow at the ejection-sweep interface would produce strong SGS energy flux there.
The space between the legs of the same U shape structure is subjected to a sweeping flow. Two adjacent legs of neighboring structures generate an ejection flow between them, which tends to lift these structures away from the wall.
As an outer-layer sweep passes along the wall, the location where strong U shape vortices are generated shifts downstream with time. Once produced and lifted by the local ejection, e.g. vortex #1 at t0-2dt, the structure is convected downstream at a faster rate than the near wall flow along the trajectory indicated by the dashed line. The next structure, vortex #2, is generated later, e.g. at t0–dt, presumably by the same sweep. Consequently, it lags behind and located below vortex #1. As the sweep progresses, it produces an inclined train of such vortices, e.g. the three structures depicted at t0. The resulting flow field would yield the x-y ridgeline plane signature sketched above.