Case Study
Multi-story composite building
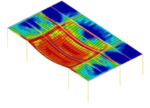
An 11-story residential building with steel-concrete composite structure is considered as a case study. A lifetime cost assessment is completed to compare the costs and benefits of various structural fire designs for the building. The layout and design of the building is consistent with the NIST full-scale fire experiments, conducted on a two-story, six-bay structure. For the prescriptive solution, the structural elements are designed to meet a 2-hour fire rating for both beams and columns, in compliance with the International Building Code (IBC).
|
Story height (ft) |
12 |
|
Floor load in fire compartment (psf) |
108 |
|
Bay size (ft × ft) |
30x20 |
|
Compartment area (sq. ft) |
600 |
|
Number of stories |
11 |
|
Projection size (ft × ft) |
180x240 |
|
Total floor area (sq. ft) |
475,200 |
Four different structural fire designs
| Design 1 | Design 2 | Design 3 | Design 4 |
Design approach | Prescriptive U.S. code | Prescriptive enhanced | PBSFD for membrane action | PBSFD minimum rebar |
Central beam | Protected | Protected | Unprotected | Unprotected |
Rebar area in S755 (value in bracket is for S480) | 60 (94) | 146 (230) | 146 (230) | 90 (142) |
Two different building locations
Two building locations are considered here. Cost variations due to location are accounted for by adjusting material and labor expenses using City Cost Index (CCI). For example, the fire protection material and labor costs in New York City (NYC) are factored by the CCI of 1.105 and 1.652 compared to the National Average value of 1, indicating higher material costs. Furthermore, to evaluate the potential rent income due to variation in construction schedule and rent loss due to fire, the unit rent costs are set as $2.64 and $6.15 per sq. ft per month for the two selected location based on data from CommercialCafe. The unit relocation costs are used to evaluate the relocation expenses the property owner would incur due to a fire event. The national average value of relocation cost is obtained from the Hazus Inventory Technical Manual, with the NYC value factored proportionally based on the difference in rent cost.
Fire load distribution
Components of the lifetime cost evaluation
Construction costs
The total construction cost is estimated based on the developed construction cost database.
The total construction cost for the building is about $54.5M when using national average cost data and about $70M with NY data. For Design 3 and Design 4, only 76% of the steel beams are protected with SFRM, as the central beams are left unprotected.
It is assumed that 8 crews of 4 workers are assigned to apply the SFRM, which requires a total of 19 days for completion for Design 1 and 2, and 16 days for Design 3 and 4.
The building lifetime is set as 50 years, and a 3% discount rate is considered. The annual maintenance cost of the floor SFRM is assumed to be a constant ratio (3% in this study) of the total floor SFRM construction cost.
| National Average | NYC | |||||||
| D1 | D2 | D3 | D4 | D1 | D2 | D3 | D4 | |
| Total building construction cost (m$) | 54.5 | 54.5 | 54.4 | 54.4 | 70.4 | 70.3 | 70.3 | 70.3 |
| Square foot construction cost ($) | 114 | 114 | 114 | 114 | 148 | 148 | 147 | 147 |
| Floor fire protection construction cost (k$) | 409 | 409 | 311 | 311 | 579 | 579 | 440 | 440 |
| Extra cost in rebar (k$) | – | 193 | 193 | 67 | – | 239 | 239 | 83 |
| Labor days in fire protection | 19 | 19 | 16 | 16 | 19 | 19 | 16 | 16 |
| Extra rent income (k$) | – | – | (69) | (69) | – | – | (160) | (160) |
| Maintenance (k$) | 317 | 317 | 241 | 241 | 450 | 450 | 342 | 342 |
| Net initial construction associated costs (k$) * | 726 | 919 | 676 | 550 | 1,028 | 1,267 | 860 | 705 |
*: The net initial construction associated costs are calculated by summing the costs of floor fire protection, extra reinforcement in the slab, and lifetime maintenance, and deducting the extra rent income.
Fire-induced losses
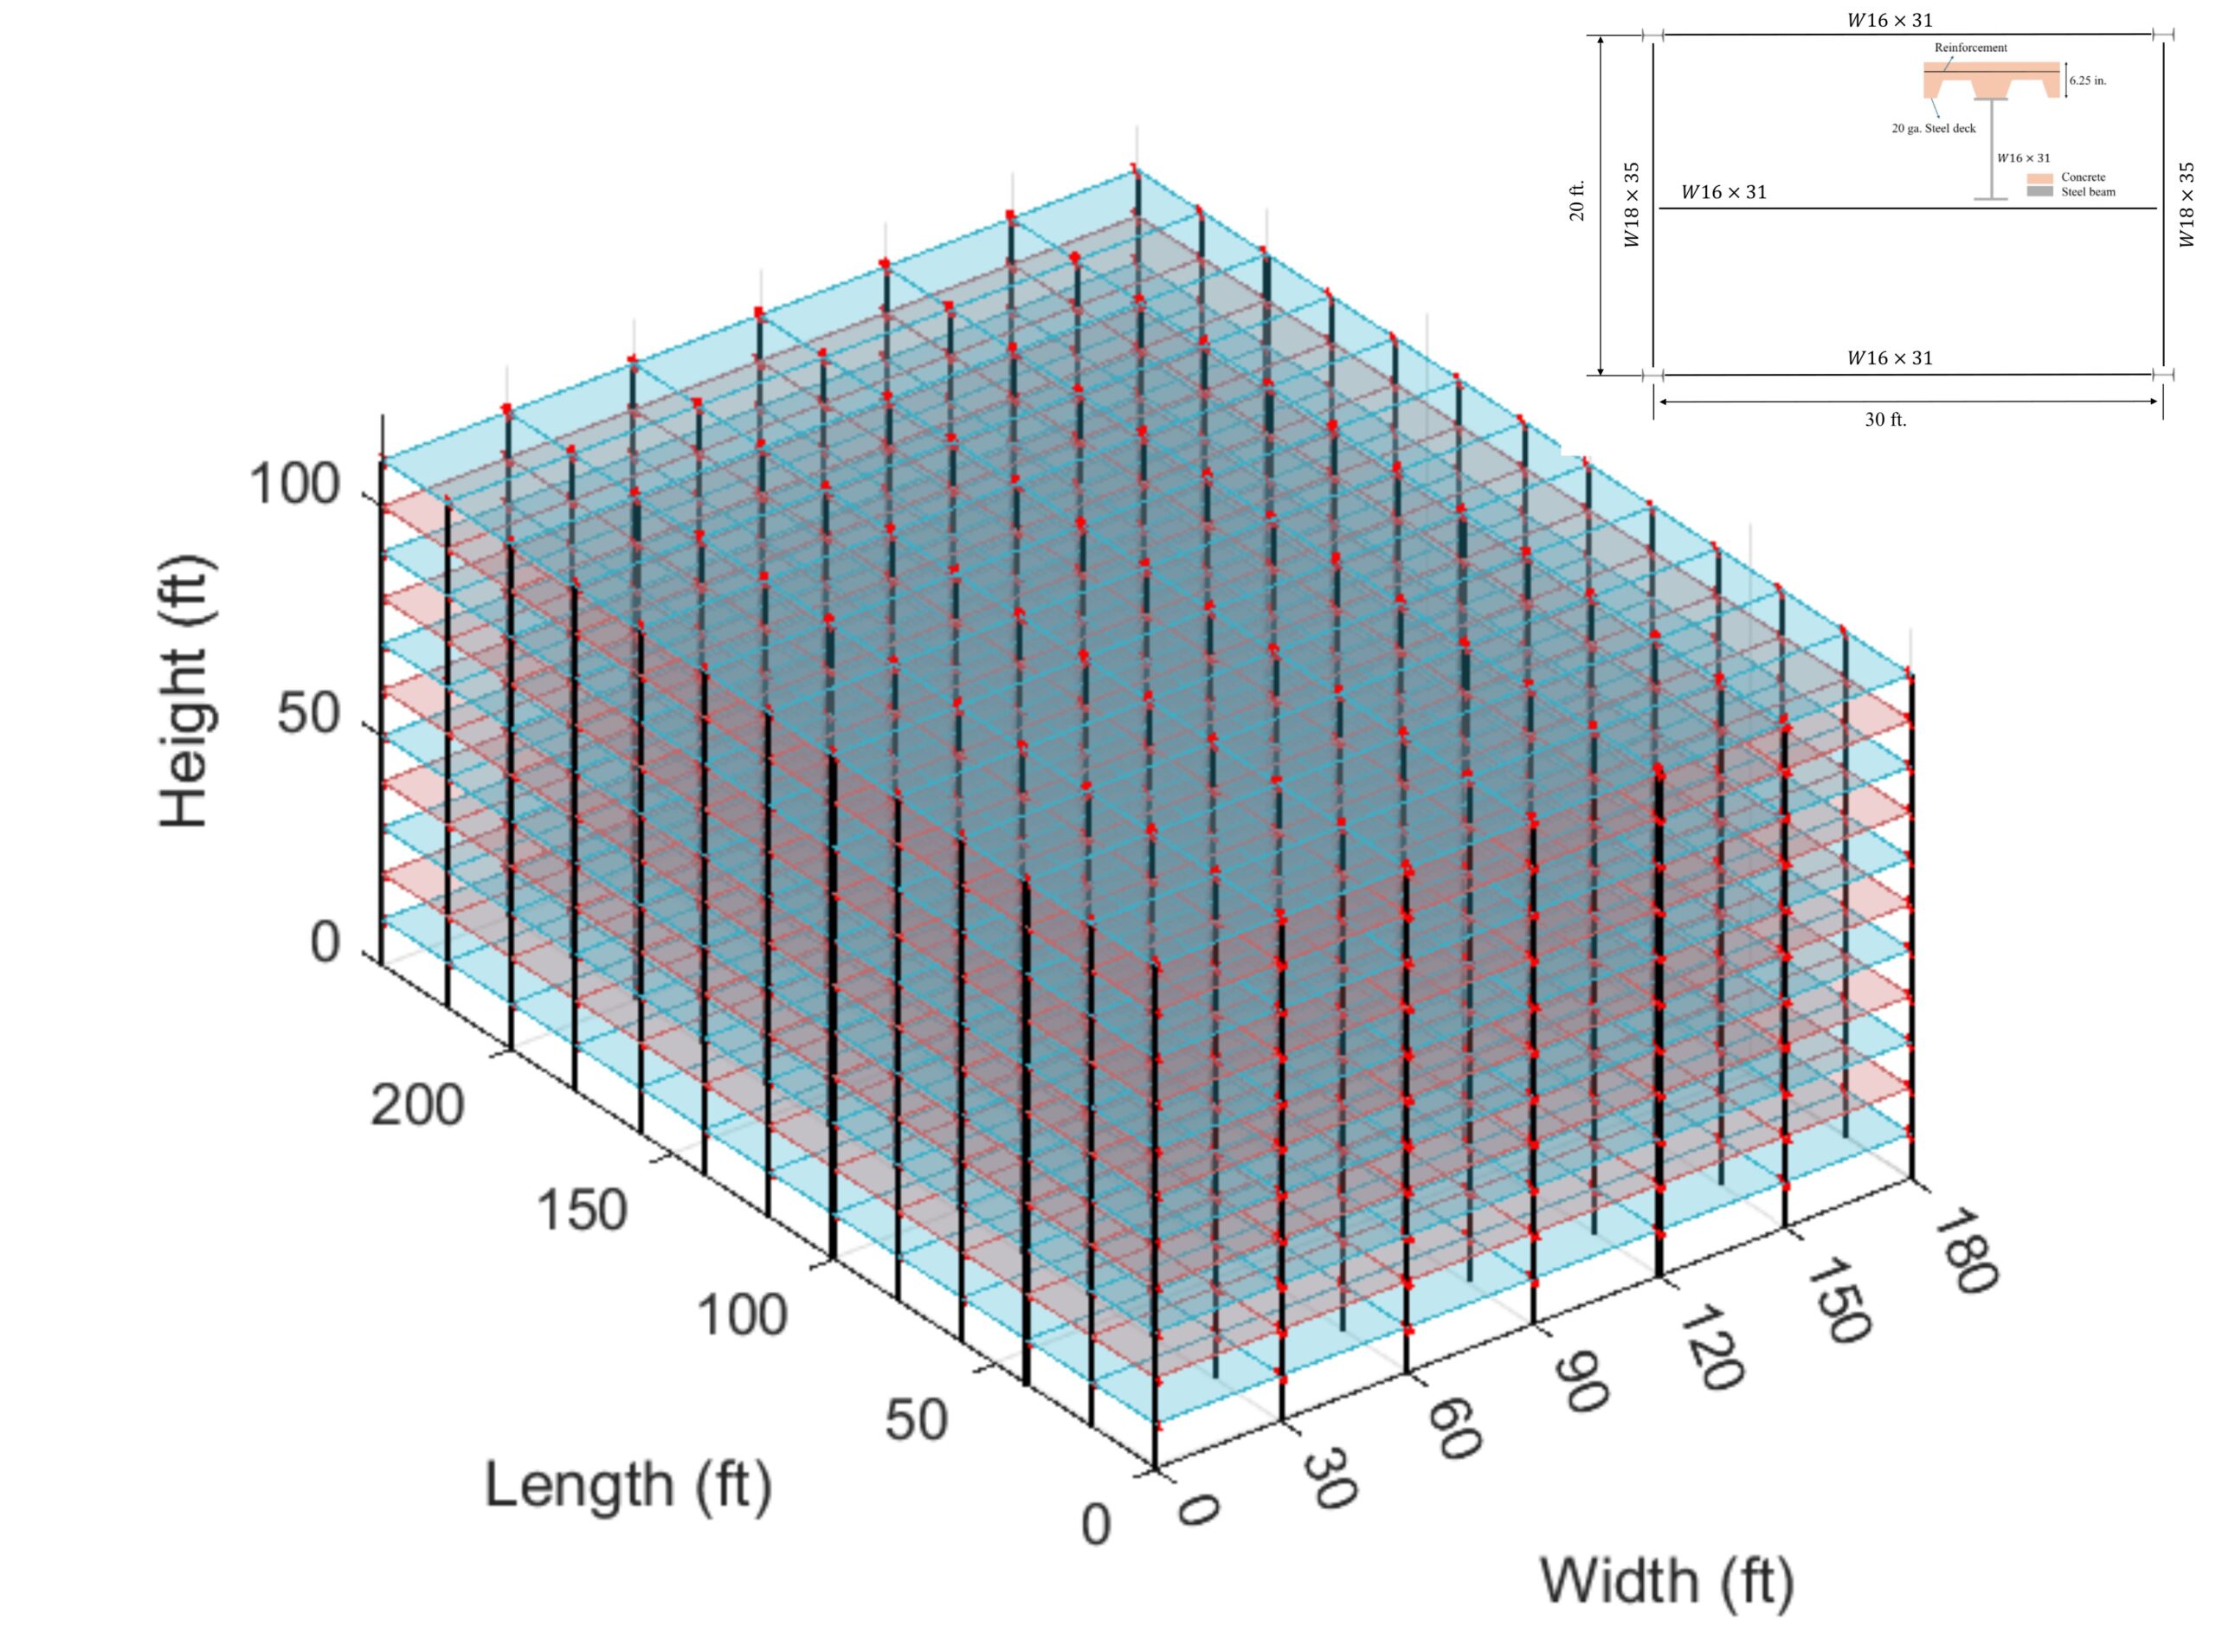
The evaluation of the cost components associated with fire damage , including the direct loss and indirect loss, requires assessing the response of the structure in the event of a fire. This assessment is conducted using fire fragility functions given the uncertainties in both fire and materials. The fragility functions characterize the probability to reach predefined damage levels as a function of the fire intensity. These damage levels are used to estimate the severity of the building after a fire event. Therefore, the lifetime damage estimation begins with the selection of fragility functions based on the structural fire design data. As the probability defined in the fragility functions are conditional to the occurrence of a structurally significant fire, the fire data including fire frequency and fire load distribution must be specified to evaluate the lifetime damage loss.
DS1 | DS2 | DS3 | DS4 | |
Criterion | 1/240 ≤ < 1/120 | 1/120 ≤ < 1/60 | 1/60 ≤ | 1/60 ≤ and steel failure or: simulation stops due to large deflection |
Fire spread status | Fire is confined to the compartment of origin | Fire spreads | ||
Fire Frequency
Direct damage losses
Direct structural losses associated with damage states DS1 to DS3 are evaluated based on the damaged structural components identified in reference. Non-structural costs are assumed to be 50% of the compartment construction cost at DS1 to DS3. For DS4, which entails structural integrity failure and fire spread scenario. The structural and nonstructural losses at different damage states, normalized by the initial compartment construction cost, with values of 0.54, 0.63, 0.76, and 200 for DS1, DS2, DS3 and DS4, respectively.
Injury losses are conditional to fire spread status and derived based on NFIRS database. The calculated injury losses at different damage states are $136,750 and $281,730 corresponding to different fire spread statuses.
Indirect damage losses
Average structural and non-structural loss per fire (k$) | Injury loss per fire (k$) | Annual loss (given fire rate of 0.0012/year) (k$) | Lifetime loss (k$) | ||
National Average | D1 | 3,785 | 176 | 5 | 245 |
D2 | 71 | 137 | 0.3 | 13 | |
D3 | 153 | 138 | 0.4 | 18 | |
D4 | 1,313 | 150 | 2 | 90 | |
NYC | D1 | 4,673 | 174 | 6 | 299 |
D2 | 93 | 137 | 0.3 | 14 | |
D3 | 212 | 138 | 0.4 | 21 | |
D4 | 1,699 | 150 | 2 | 114 |
The demolition costs are assumed to be 50% of the installation costs. The sum of installation and demolition costs are then used to evaluate the labor days needed to repair the components. The maximum number of workers on-site is limited to 118 . Additionally, it is assumed that a maximum of four workers are allocated per 1,000 sq. ft. in each compartment. It is assumed that the entire building will remain closed until the structural components are repaired when the fire spreads (damage state DS4). These closed areas and days can be interpreted as indirect consequences, ranging from unavailability of 600 sq. ft in the building for half a month at DS1 up to unavailability of the whole building for about 3 years at DS4.
Relocation cost (k$) | Rent loss (k$) | Average loss per fire (k$) | Annual loss (k$) | Lifetime loss (k$) | ||
National Average | D1 | 155 | 7,455 | 7,610 | 9 | 470 |
D2 | 2 | 65 | 67 | 0.08 | 4 | |
D3 | 5 | 202 | 207 | 0.26 | 13 | |
D4 | 53 | 2,548 | 2,602 | 3 | 161 | |
NYC | D1 | 362 | 17,371 | 17,732 | 22 | 1,096 |
D2 | 4 | 152 | 156 | 0.19 | 10 | |
D3 | 11 | 475 | 483 | 0.60 | 30 | |
D4 | 125 | 5,938 | 6,062 | 7 | 375 |
Co-benefits associated with the fire design
A medium-density SFRM (minimum 22 pounds per cubic foot) is considered, which produces 493 kg of CO₂ emissions per 1,000 kg of SFRM.
The CO2 emission during construction phase, post-fire CO2 emissions, annual post-fire CO2 emissions and lifetime CO2 emissions are summarized.
PBD methods save approximately 3 tons of CO2 emissions in SFRM during the construction phase compared to prescriptive methods. During the post-fire recovery phase, Design 1 has the highest CO2 emissions, around 1,000 tons per fire, whereas Design 3 has significantly lower emissions at approximately 45 tons.
Overall, Design 1 exhibits the highest lifetime CO2 emissions, followed by Design 4, Design 2, and Design 3.
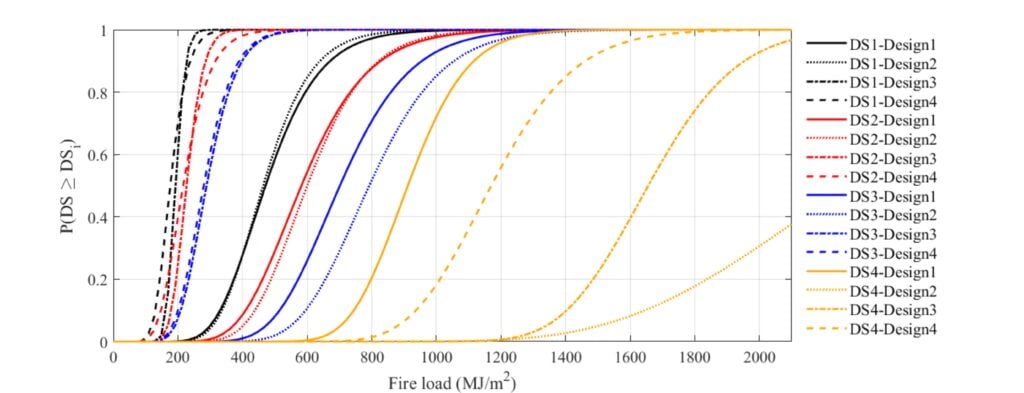
Economic impact of the structural fire designs
The following table and figure present a detailed breakdown of all cost components, the present value lifecycle costs (PVLCC), and the environmental consequences for the four designs at two different locations. The results indicate that, based on the inputs and assumptions stated above, Design 3 has the lowest economic and environmental costs. Though Design 4 has the lowest construction cost among the four designs, its direct and indirect losses are significantly greater than those of Design 3, resulting in higher PVLCC and lifetime CO₂ emissions. While Design 2 has the lowest direct and indirect losses, the extra investment in reinforcement is not compensated by the reduction in losses, making it less favorable than Designs 3 and 4. Design 1, which represents the current U.S. prescriptive codes, has the highest PVLCC and lifetime CO2 emissions due to the significant lifetime losses. The differences in PVLCC are more pronounced in NYC compared to the national average, primarily due to the higher indirect losses associated with building closures.
| Construction cost (k$) | Maintenance (k$) | Rent Income (k$) | Direct loss (k$) | Indirect loss (k$) | PVLCC (k$) * | CO2 emission (ton) | |||
| National Average | D1 | 409 | 317 | – | 245 | 470 | 1,441 | 254 | |
| D2 | 602 | 317 | – | 13 | 4 | 936 | 192 | ||
| D3 | 504 | 241 | 69 | 18 | 13 | 708 | 162 | ||
| D4 | 378 | 241 | 69 | 90 | 161 | 801 | 182 | ||
| NYC | D1 | 579 | 450 | – | 299 | 1,096 | 2,424 | 254 | |
| D2 | 818 | 450 | – | 14 | 10 | 1,291 | 192 | ||
| D3 | 679 | 342 | 160 | 23 | 30 | 912 | 162 | ||
| D4 | 523 | 342 | 160 | 114 | 375 | 1,193 | 182 | ||
The construction cost includes the investment in the beam fire protection and extra cost in the slab reinforcement.
*: The PVLCC is calculated by summing the costs of construction, maintenance, direct loss, indirect loss, and then deducting the rent income.
Recommendations
The designs based on the PBD (Design 3 and 4) result in lower lifetime costs and reduced environmental impacts compared to the prescriptive design (Design 1). This reflects the lower expected fire-induced losses of the PBD as well as efficiency in construction with lower amount of SFRM, compared to the prescriptive design. The advantage of the PBD is particularly marked for occupancies that have low to medium fire loads (e.g., hospital, school, theatre, etc.). The design based on prescriptive approach with added reinforcement (Design 2) may become more cost efficient for very high expected fire loads (e.g., library). This also illustrates that the proposed method can be used to identify the optimum designs as a function of the parameters specific to a type of building or occupancy.
Lifetime costs (k$) for the four designs at different fire load distributions (with g-value of 200)
Occupancy | Fire load | Prescriptive method | PBD method | |||
mean | sd | D1 | D2 | D3 | D4 | |
Hospital | 230 | 69 | 727 | 919 | 684 | 559 |
School | 285 | 85.5 | 728 | 920 | 686 | 561 |
Theatre | 300 | 90 | 729 | 920 | 687 | 561 |
Hotel | 310 | 93 | 728 | 920 | 687 | 562 |
Office | 420 | 126 | 751 | 923 | 688 | 565 |
Shopping centre | 600 | 180 | 952 | 928 | 690 | 615 |
Dwelling | 780 | 234 | 1,436 | 935 | 706 | 805 |
NFPA office [51] | 1158 | 541 | 2,315 | 1,015 | 1,003 | 1,585 |
Library | 1500 | 450 | 3,110 | 1,102 | 1,335 | 2,383 |
Lifetime CO2 emissions (ton) for the four designs at different fire load distributions (g-value of 200)
Occupancy | Fire load | Prescriptive method | PBD method | |||
mean | sd | D1 | D2 | D3 | D4 | |
Hospital | 230 | 69 | 191 | 191 | 160 | 160 |
School | 285 | 85.5 | 191 | 191 | 160 | 160 |
Theatre | 300 | 90 | 191 | 191 | 160 | 160 |
Hotel | 310 | 93 | 191 | 191 | 160 | 160 |
Office | 420 | 126 | 192 | 191 | 160 | 160 |
Shopping centre | 600 | 180 | 209 | 191 | 160 | 164 |
Dwelling | 780 | 234 | 249 | 192 | 162 | 180 |
NFPA office [51] | 1158 | 541 | 321 | 198 | 185 | 243 |
Library | 1500 | 450 | 387 | 206 | 214 | 311 |